
Location Tracking Map
Jessica Chen (jc2538) and Vidya Ramesh (vr236)
Date: May 17, 2018
Objective
We set out to build a interface to show real time location data for a number of users on a visual interface. The system needs a cloud component and app to allow remote communication between a number of users from various locations and local endpoint to download this data and display. The system will be built using IoT tools and services such as Node Red and MQTT.
Introduction
Our final project stemmed from our interest and not insignificant use of location sharing apps. We use these to find our friends on campus, check in on people when there are dangerous events or catastrophes in their regions, or just see if someone has gotten home from work yet. While there are several software apps which implement theses features such as Google Maps and Find My Friends, we wanted to build a hardware interface which would allow users to have a visual display of all their friends/family on a map. We wanted the map to be interactive and allow for zooming or scrolling functionality to allow users with friends and family spread out across the world to be able to focus in on different regions or view all connected users at once. The project also presented an avenue to learn more about cloud servers and everything that goes into setting up a end to end IoT system.
Design
Overview
Our final system consisted of several moving parts. The OwnTracks app on our phones pushed location data to the CloudMQTT platform, from which the Raspberry Pi downloaded information using a Node-Red workflow. The workflow opens and sends the location data as a JSON from the cloud to a Python script, where it is then outputted as a text file (.txt). A Javascript script then reads the output text file and updates individual locations on a map in real-time using the Google Maps API. The map is displayed on a locally hosted server and updated at a preset interval. Figure 1 below shows the MQTT flow that the location data goes through to get to the Raspberry Pi.
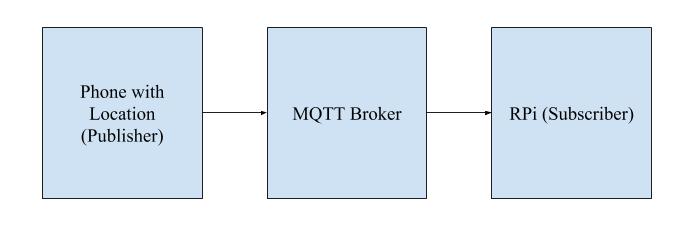
Figure 1: MQTT Data Flow
Remote Systems
OwnTracks is a free mobile application available for Android and iOS. It can be used to connect to a cloud server and publish location data when configured with the correct settings. For our project demonstration, we downloaded the app onto three phones, two of which were located on the Cornell University campus and one of which was located in New York City. The app communicates with the server using MQTT, a lightweight communication protocol built for embedded and IoT applications. The cloud server we used was CloudMQTT, which provides free plans for up to 5 connected devices. The server acts as a message broker for data published by OwnTracks. The online interface provides a Websocket UI which allows published messages to be viewed in real time, making debugging connections easy. The server can also be connected to using the Node-Red interface, which made it suitable for our purposes. Once we set up a plan on the CloudMQTT website, we were able to access the port numbers needed to establish communication between the Owntracks app and the broker.
Software
Node-Red is a programming tool built by IBM for IoT devices. The interface includes a graphical programming flow which allows for the establishment of communication between hardware and embedded systems (in our case, the RPi) and online servers, APIs, etc. We used the interface to communicate with the CloudMQTT platform described in the previous section. Specifically, we used MQTT nodes to interface with the broker, the JSON converter node to parse the information pulled, and the node-red-contrib-pythonshell node to execute and pass in the required information as arguments to a specified Python script. Each time a new piece of location data from a user was sent through, the Python script would be newly executed and run through to completion. Additionally, everytime the Node-Red flow was deployed, data from all users was passed through to the Python script (meaning that if there were 3 users connected in the Node-Red flow, then the Python script would run 3 times at the initial Node-Red deployment). After the initial deployment, depending on the user, location data from each user was sent at differing but somewhat regular intervals. The complete Node-Red flow is shown in Figure 2 below.
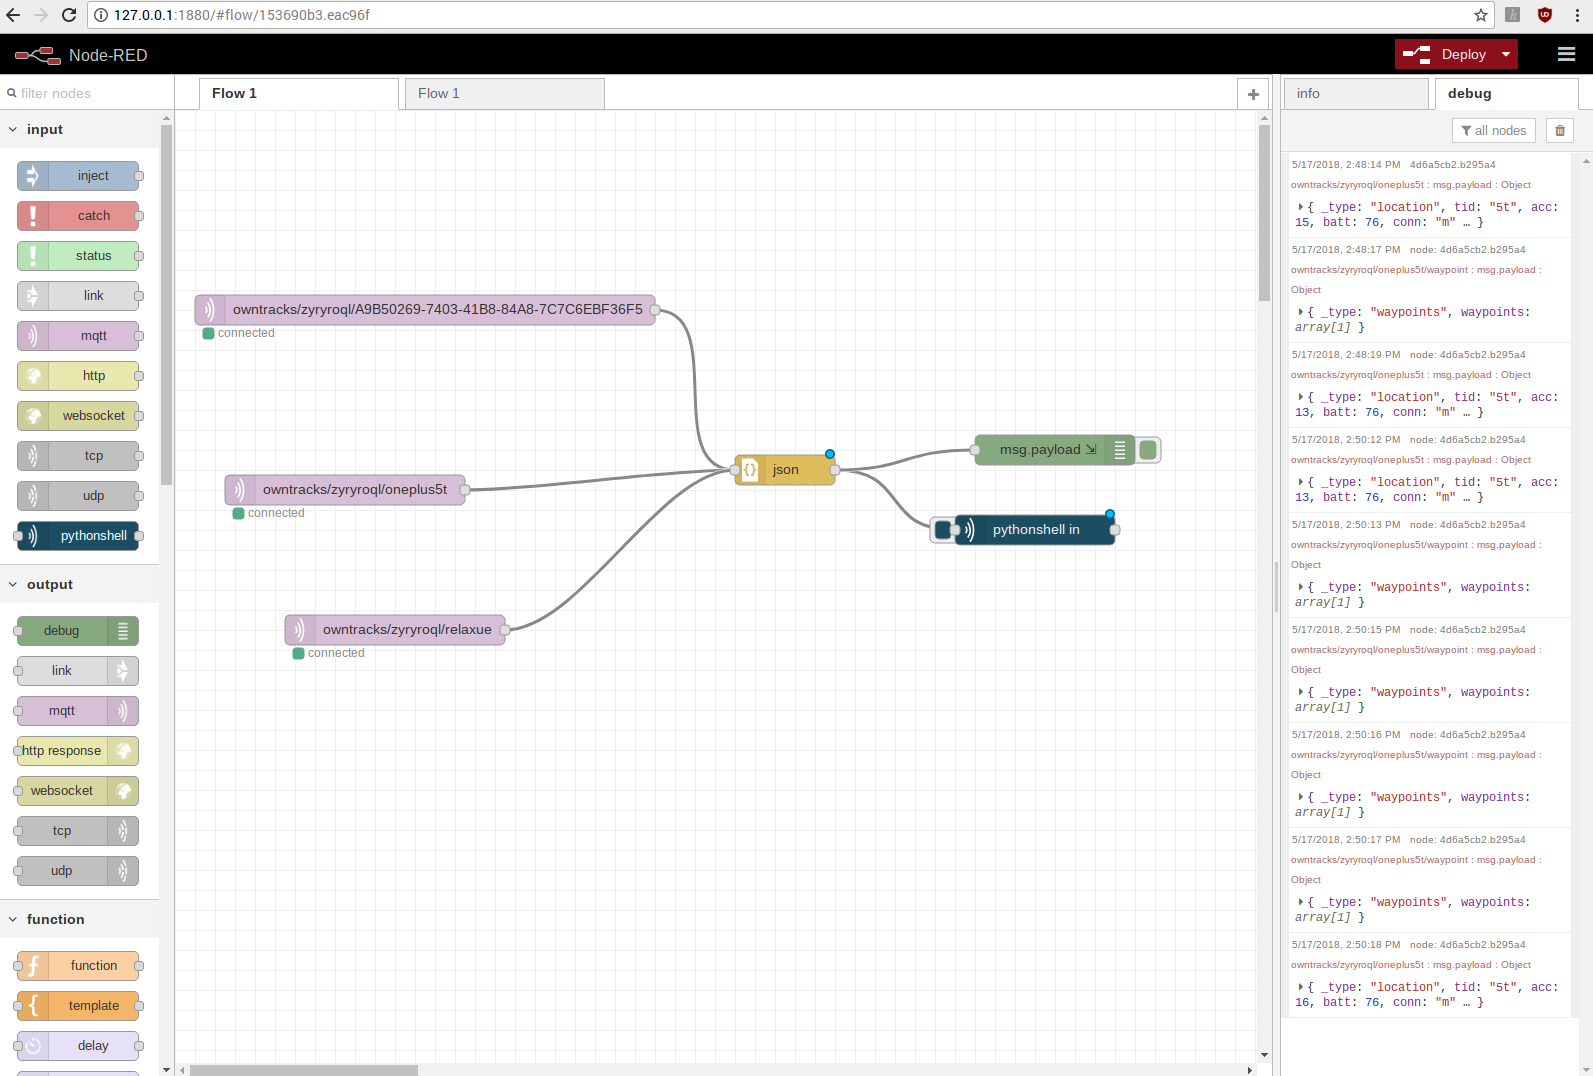
Figure 2: Node-Red Flow
The Python script called by the Node Red flow was very basic. The incoming variable passed as a system argument was checked for key terms which identified the user whose data was being sent in. Each user was assigned to his/her own output text files, so based on the key identifier, different text files were opened and location data received by the script was printed in the file.
The HTML (and Javascript) element of the design was responsible for generating the map using the Google Maps API and identifying user locations with markers. The script used jQuery to refresh a function, refresh() that read in location data from each of the individual text files written to by the Python script. At the end of refresh(), a Javascript function drawMap() was called to update the dictionary 'dict' with the retrieved location data. The dictionary kept track of each user's data by storing user identifiers (each user was given a unique 'tid' property by CloudMQTT) as keys and the corresponding JSON object that contained the user location information, including latitude and longitude, as values. These latitude and longitude values for each user were then placed into a data table to be accessed by the Google Visualization API to render a map with pins at these locations. We also used the API to allow for different map views, such as terrain view and street view. The figures below show the map in 3 different views, as well as zoomed in.
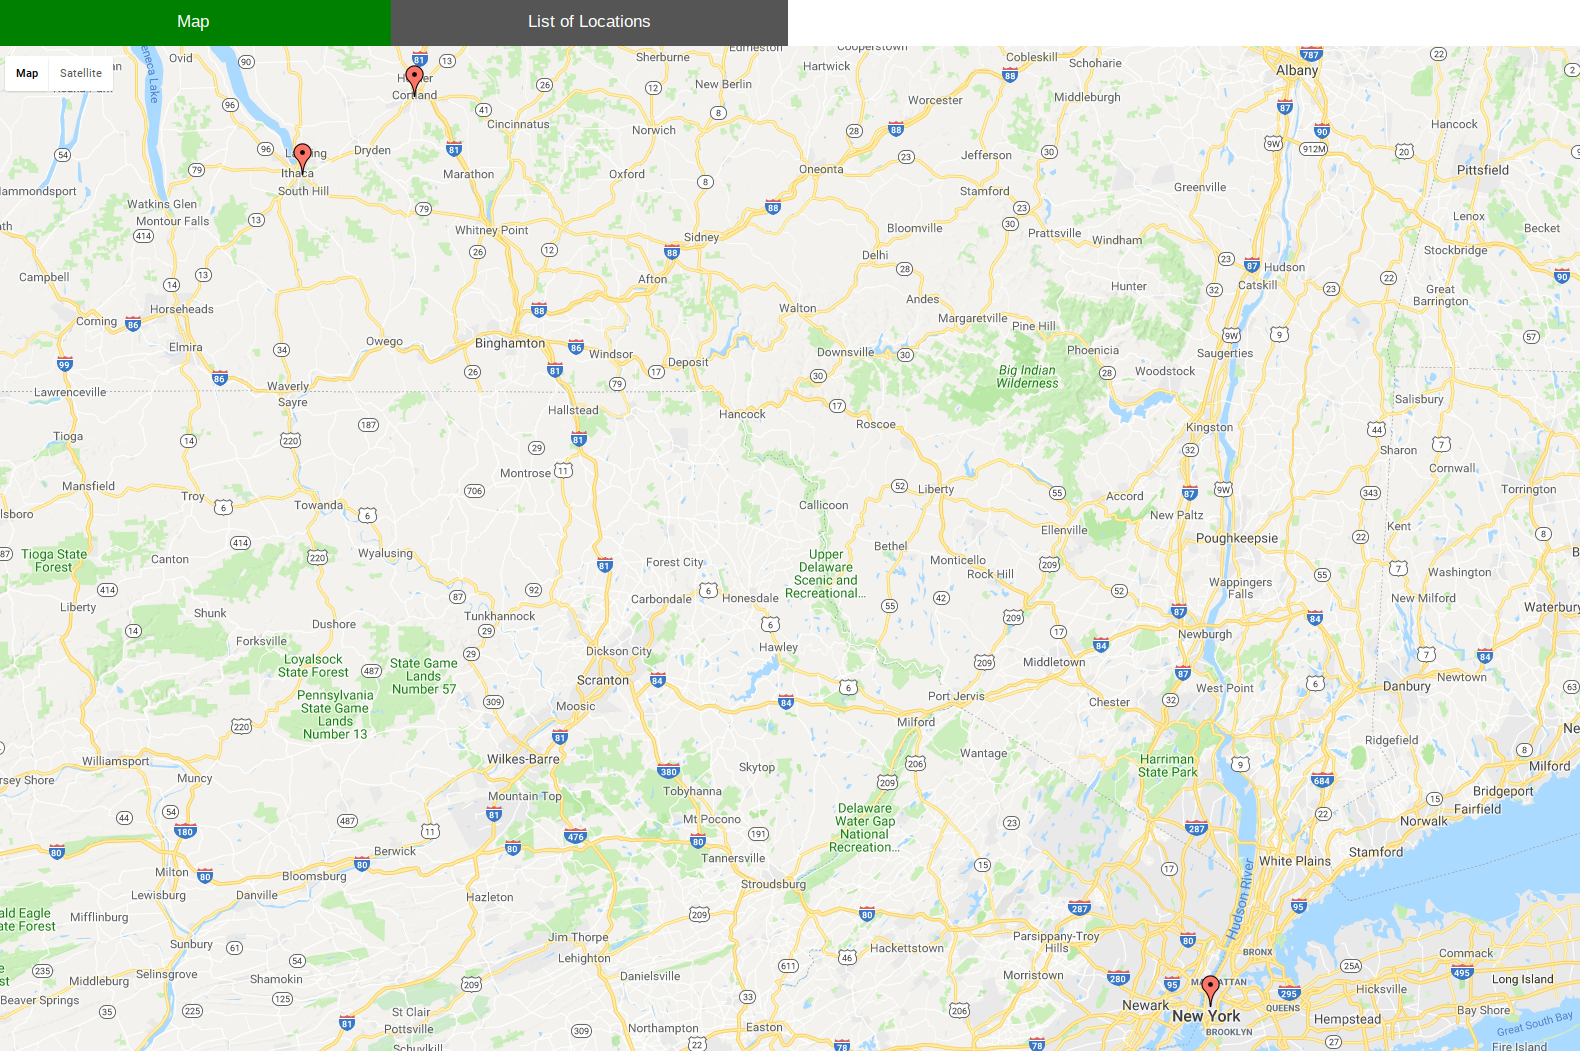
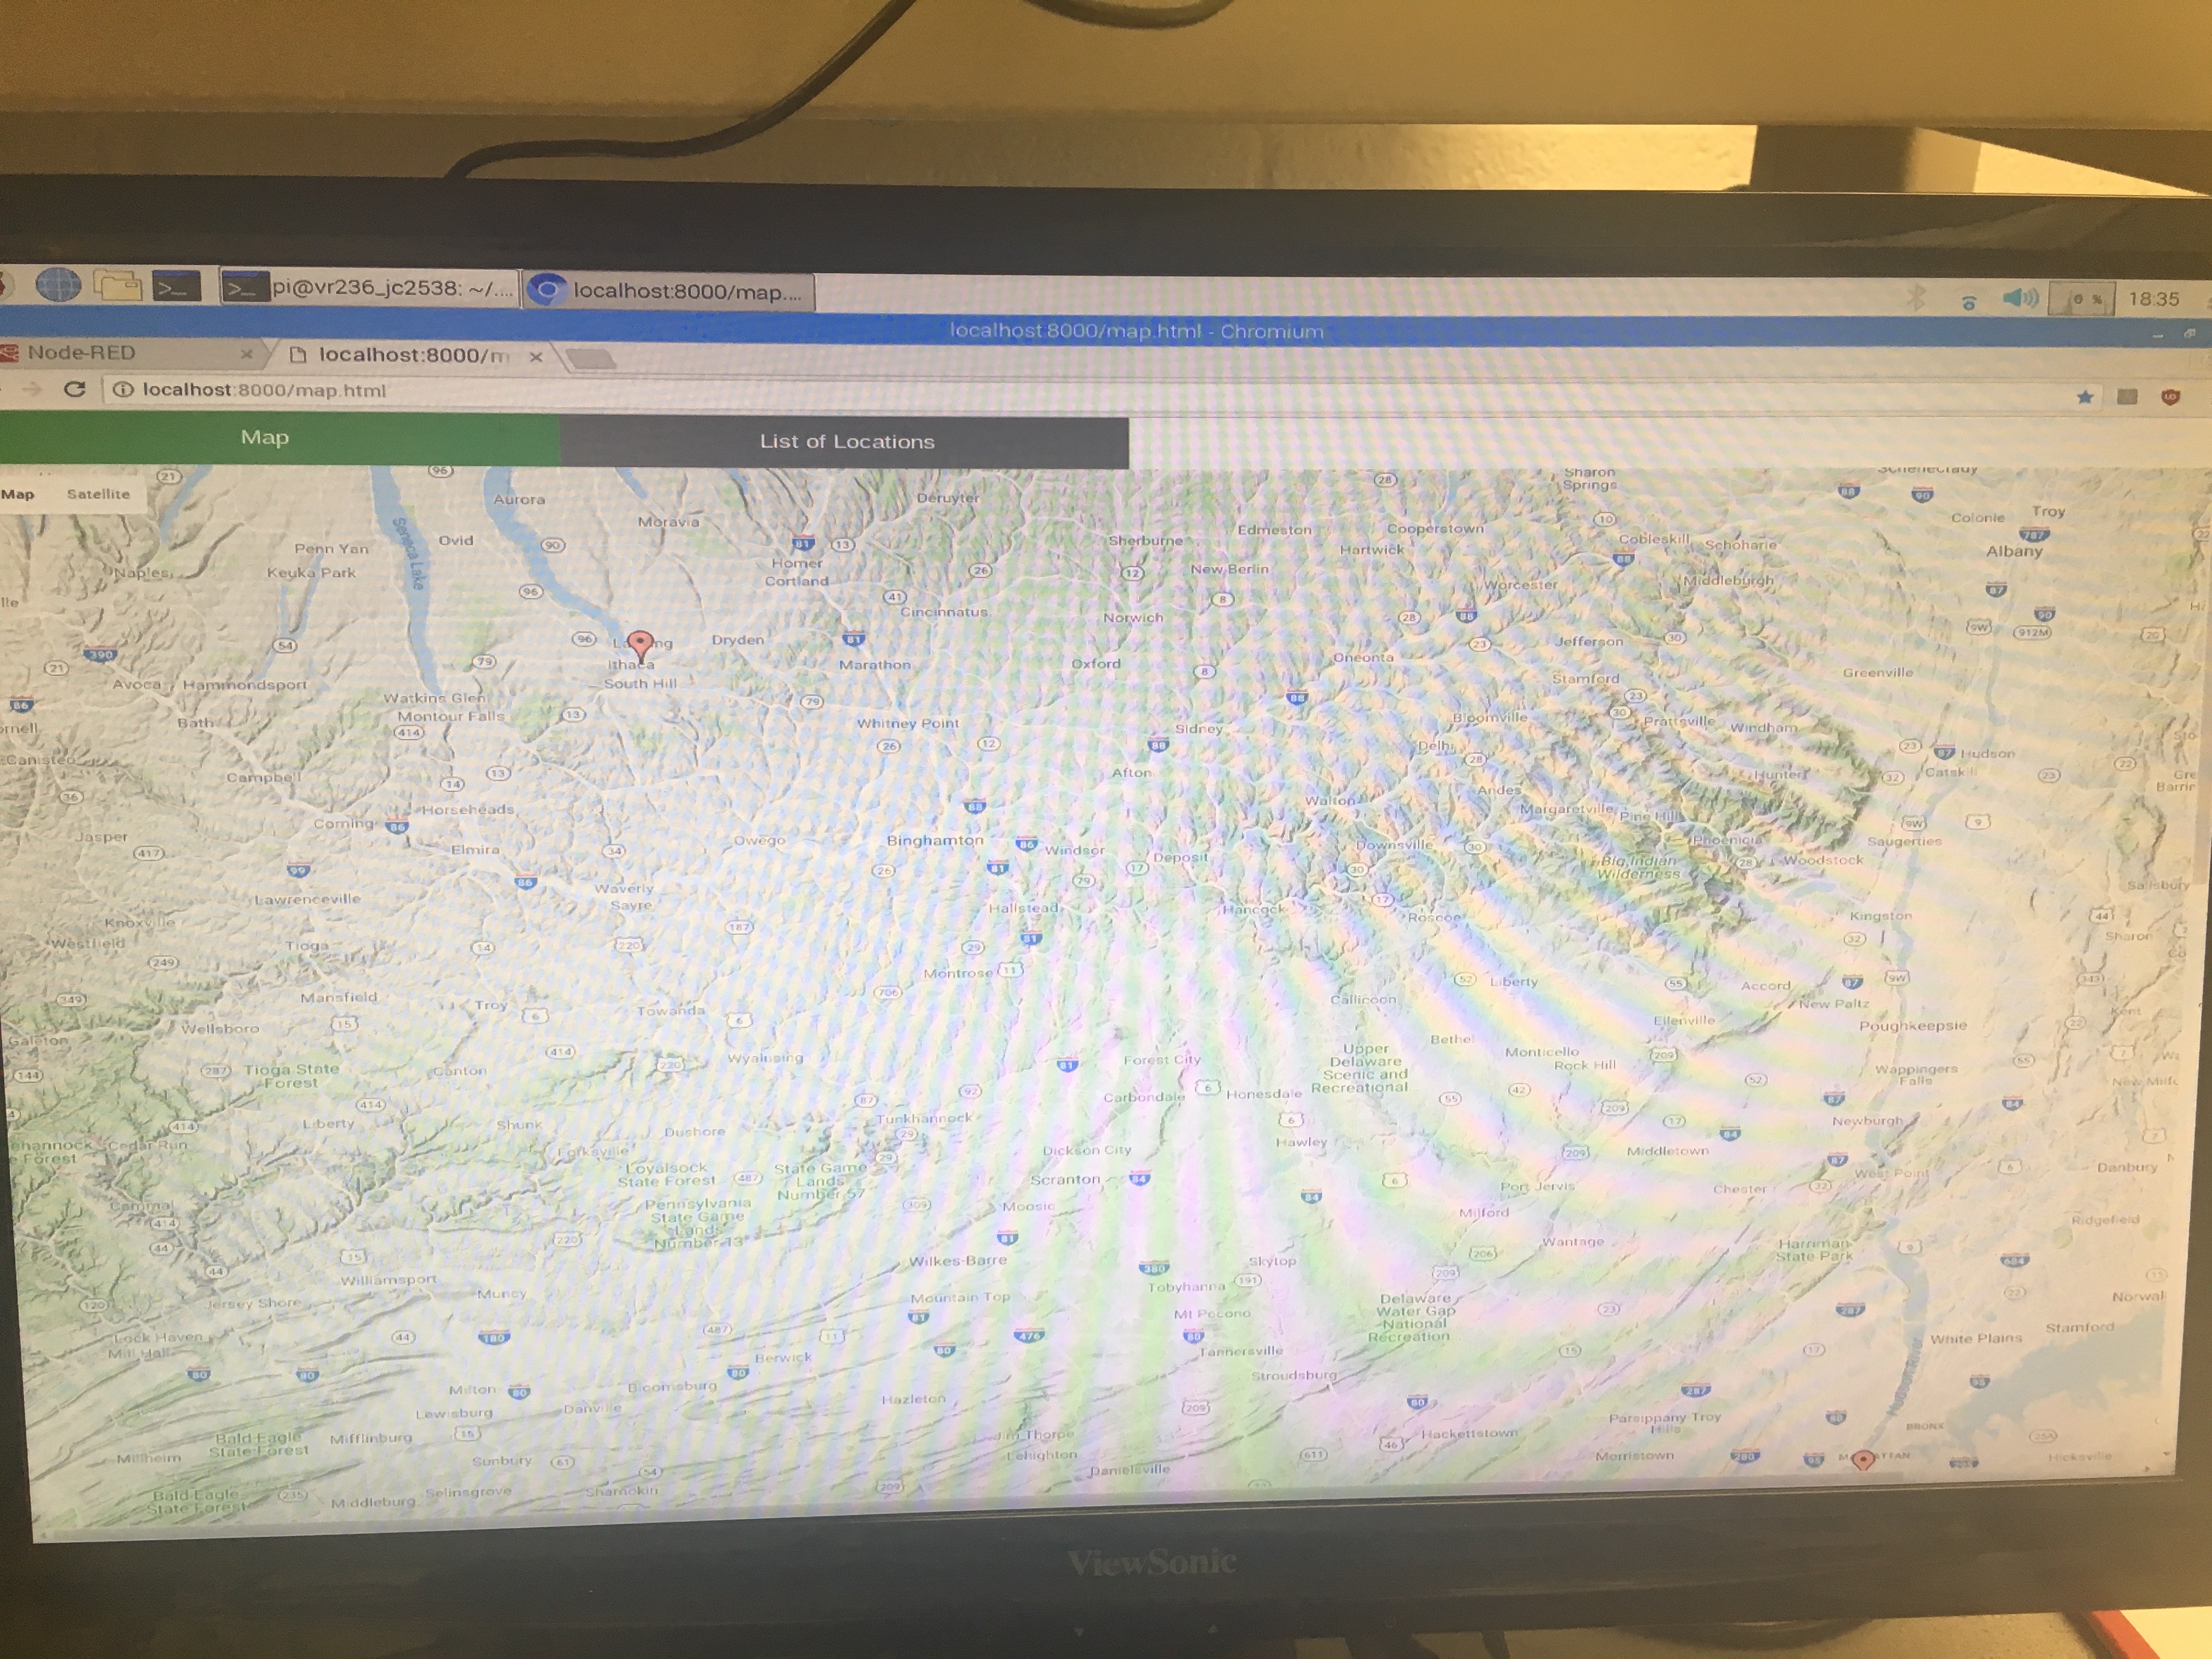
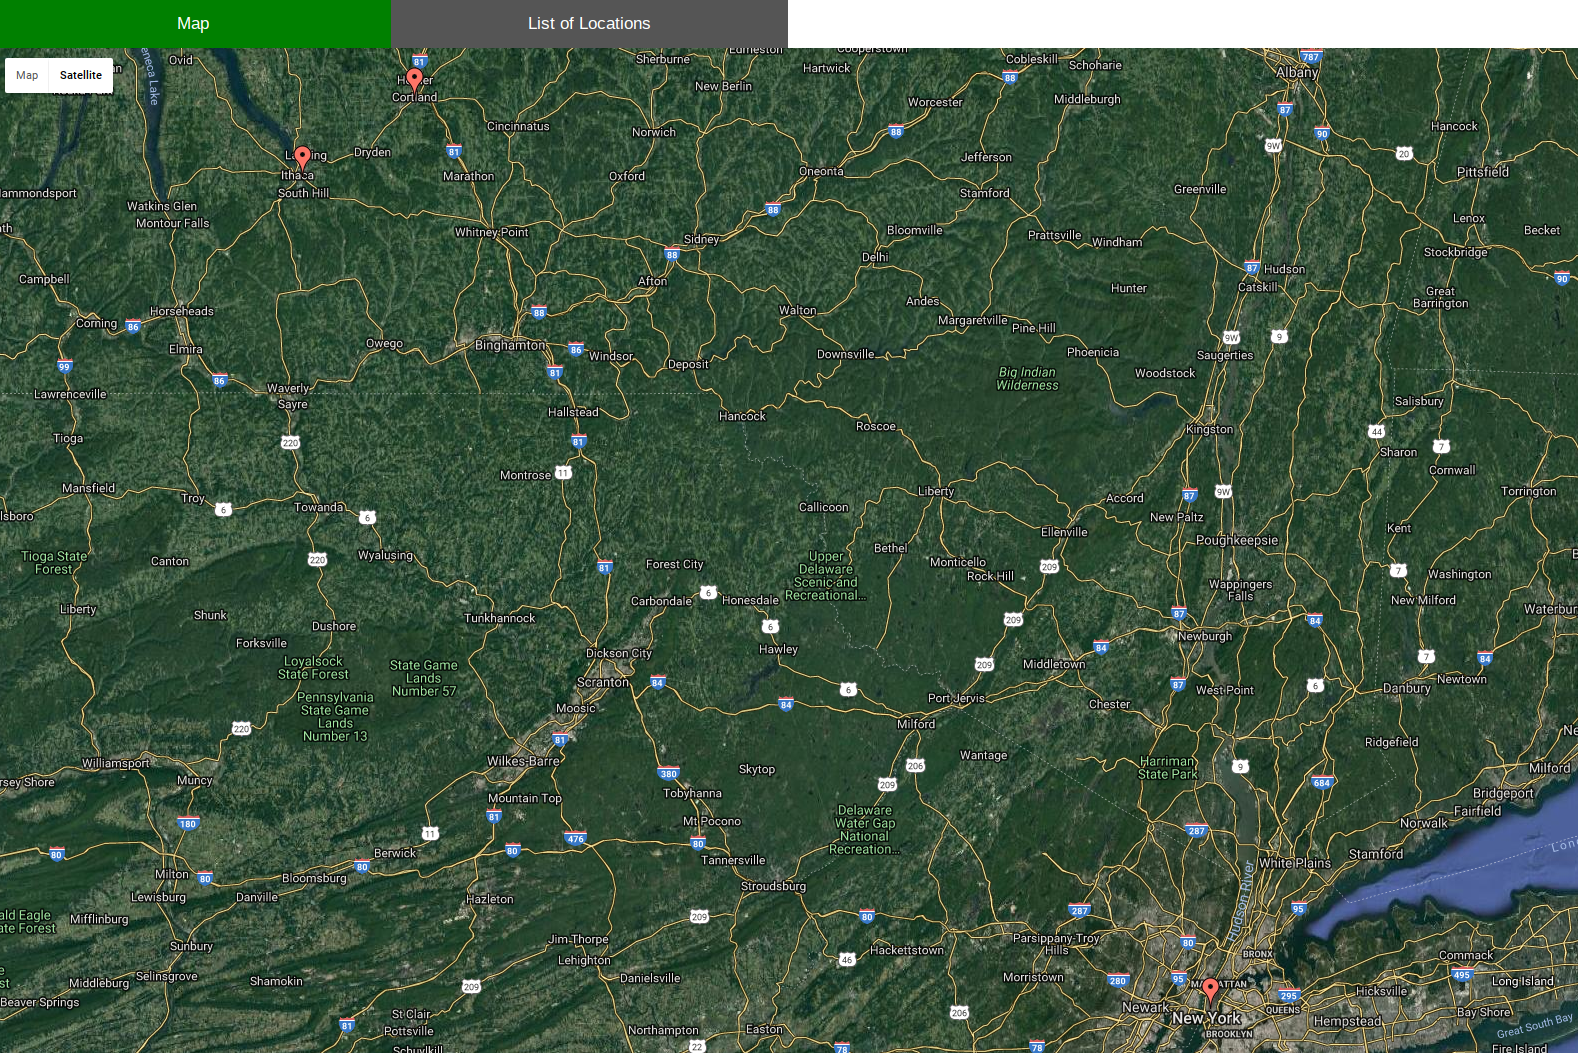
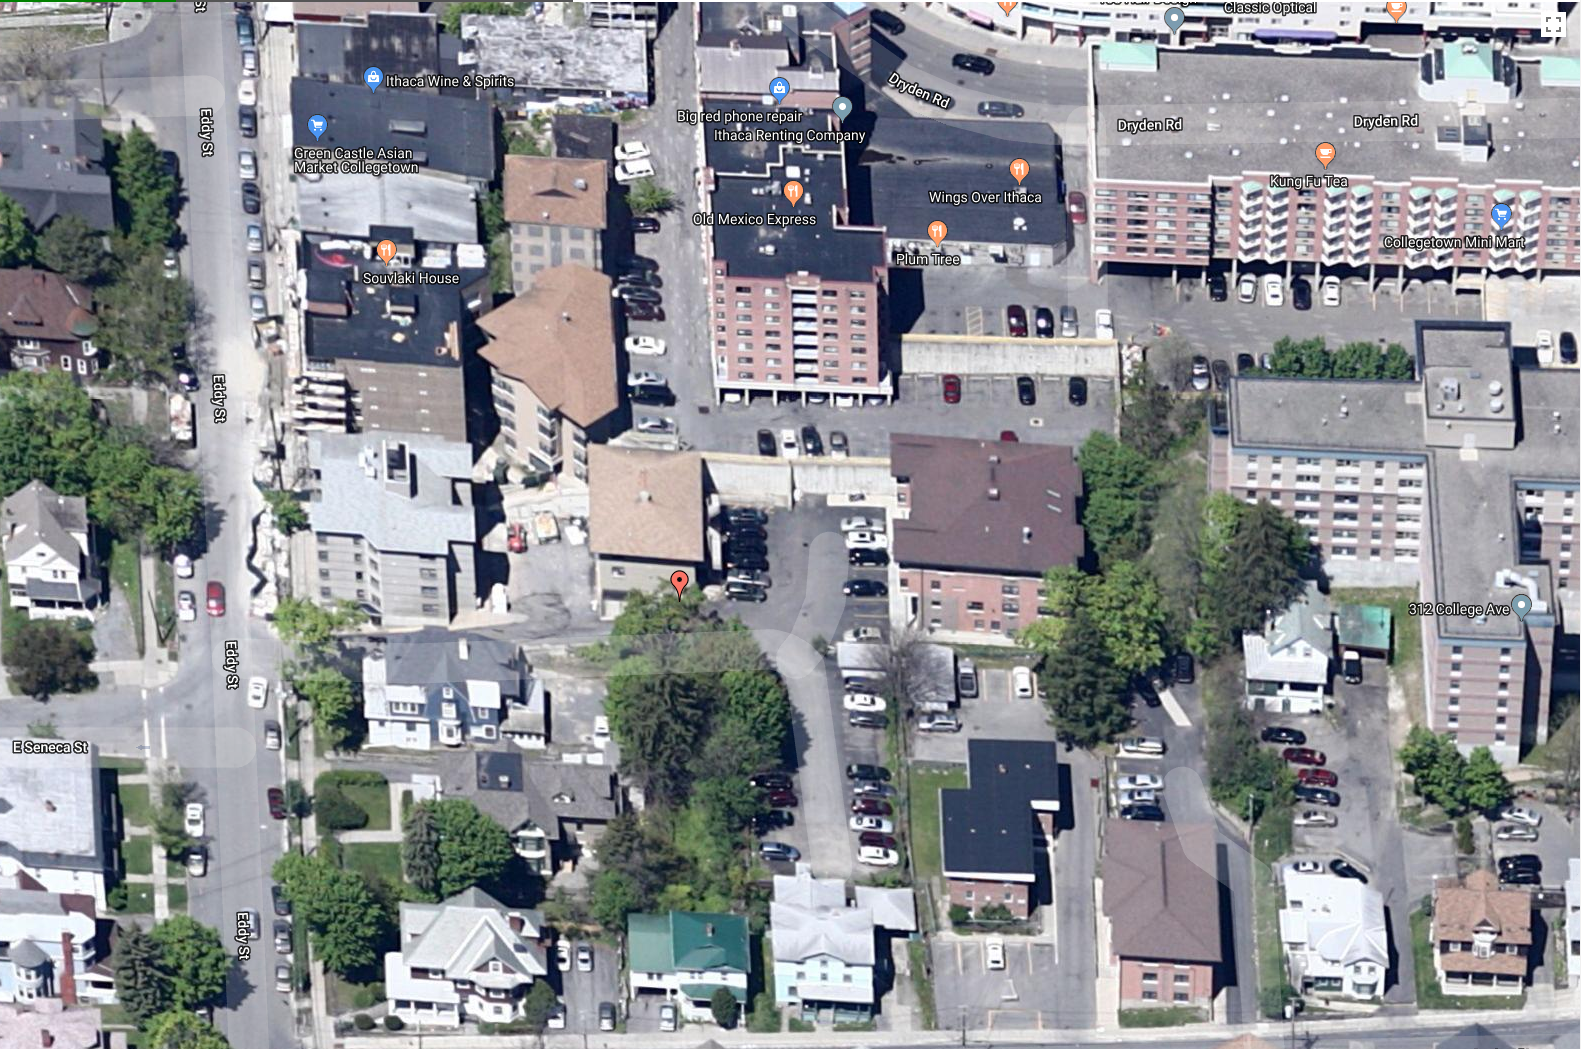
Figure 3: Map View Options and Zoom-In Features
On page start-up, the function required 3 refreshes via refresh() to retrieve all of the necessary location data to properly display the map. As a result, we chose to make these first 3 refreshes occur in 1 second intervals to decrease the wait time required for the page to first load. The subsequent refreshes occurred once every 2 minutes to grab the most recent data from the text files to ensure that the pins on the map were accurate. This intervval of 2 minutes could easily be modified in the code based on the map viewer's preference. Both the Python and HTML code can be found in the Code Appendix section.
Hardware
The map was displayed on an HDMI monitor that was plugged into the RPi in place of the lab monitors that had been used earlier in the course. The monitor was unfortunately not touch screen; however, scrolling and other functions could be accessed using the piTFT which was connected to the RPi system.
Testing
Other Attempted Approaches
We initially attempted to communicate between the HTML file that rendered the map and the Python script called by Node Red using Flask, a Python framework. This would have been a much more sophisticated method to complete our project than our idea with the text files. However, because Node-Red required that the Python script be run to completion each time a new location was sent, this conflicted with the HTML since the HTML page had to be kept running in order to keep the map open and update pins on it. Thus, we were unable to implement our project using Flask. We also tried using TCP and UDP sockets to communicate between scripts, but ran into similar errors here too. We found that using a common text file as the interface was the cleanest form of establishing the required communication.
Bugs and Issues
While some parts of this lab were straightforward to implement, much of it involved working with languages, tools, and frameworks we had never encountered before, such as Node-Red, Flask, JQuery, and the entire Cloud platform. As a result, it often took us longer than anticipated to get our footing when building some aspects of the project. For example, because there were few, if any tutorials on how to actually export the data to Python a an argument rather than only displaying the received information in the Debug console of Node-Red, which most other tutorials did, we spent almost an entire week trying to get past this point. Ultimately, we realized that we had to import a new node node-red-contrib-pythonshell. In addiont, finding a way to communicate between Python and Javascript also took more time than expected, as outlined in the previous section.
Testing Methods
Much of the testing for the system was performed simply by observing visual cues in the tools or interfaces that were used. When setting up the OwnTracks app and CloudMQTT platform, we were able to see that communication had been established between the two using the OwnTracks Websocket UI and viewing the published messages. When connecting the Node-Red flow to the Cloud, we were able to see indicators on the graphical interface (marked each MQTT node as 'connected' if there were no errors) which showed whether a connection had been established. Later, we were able to use both the Debug console of Node-Red that was printing data via the debug node (marked msg.payload in Figure 3), as well as the output text files updated by the Python script to see if outputs had been received. On the HTML webpage side, we were able to use the terminal command 'python -m SimpleHTTPServer' to visualize the map generated and the locations marked to determine whether the script was running as expected. (To debug any errors in our HTML file, we used the Javascript command 'console.log()' to print values to the Console on our locally hosted site.)
Results
We were able to accomplish the majority of the goals outlined in the description. The basic functionality of the system is as described; however we made some changes to the overall design on the way. While we initially planned to use an LED matrix to display location on a map, we later chose to use the Google Maps API and an HDMI monitor instead, as this provided additional functionality such as zooming, scrolling, and a wider total viewable area than would have been possible with an LED matrix. We had also initially considered implementing additional features using the OwnTracks app's “Regions” feature. This allows demarcation of specific areas and could have been used to alert users when another user was entering or leaving specific regions. While we experimented with this on our apps, we did not incorporate this feature into our final design due to a time shortage.
Apart from the changes described above, our system meets the requirements we originally defined: our map interface works in real-time to update user locations on an LCD map display based on data the RPi pulls from a cloud service. We were able to distinguish between multiple users on the map by using different icons and also preserved touchscreen functionality using the piTFT screen even though the LCD display was not a touchscreen. This met all of goals outlined in our initial Project Proposal.
Conclusion
As mentioned in the results section, our project achieved the goals we set out to accomplish. We were able to set up a real-time location tracking system similar to that implemented by apps such as ‘Find My Friends’, but with an included hardware interface. The location data pushed to the map from the cloud is quite accurate. Thus, any lack of accuracy here is more likely due to inaccurate phone GPS systems than due to losses in data during movement of data through different parts of the system.
The one thing that we realized would not work was using the Node-Red system to add large numbers of people to one's map. While it is possible, each time a person wants to be added to the map, a separate node on Node-Red must be manually created and connected to the JSON node so that Node-Red can receive data from the new source. Thus, it would not be wise to try to scale up the number of individuals on a map due to the lack of efficiency and convenience of this particular system in adding new location sources.
Work Distribution
All coding for the assignment was done with both partners present - we used pair programming practices during all of our lab sessions. We took turns coding different parts of the design and made sure that both of us had the chance to work on all parts of the system. The report was written and the website was made in a similar fashion. Together, we wrote down bullet points for every section and each expanded on various sections, after which we made the webpage by again using pair programming practices.
Future Work
If we had more time to work on this project we would implement additional features such as location history tracking. Additionally, we could implement filters to allow for only certain groups of people to be viewed on the map such as family or friends. None of these features require significant additional setup in terms of external interfaces or tools, but would add more interactive features and make the system more engaging.
Bill of Materials
Table 1 below shows a list of all of the materials we used to complete this project, as well as their cost.
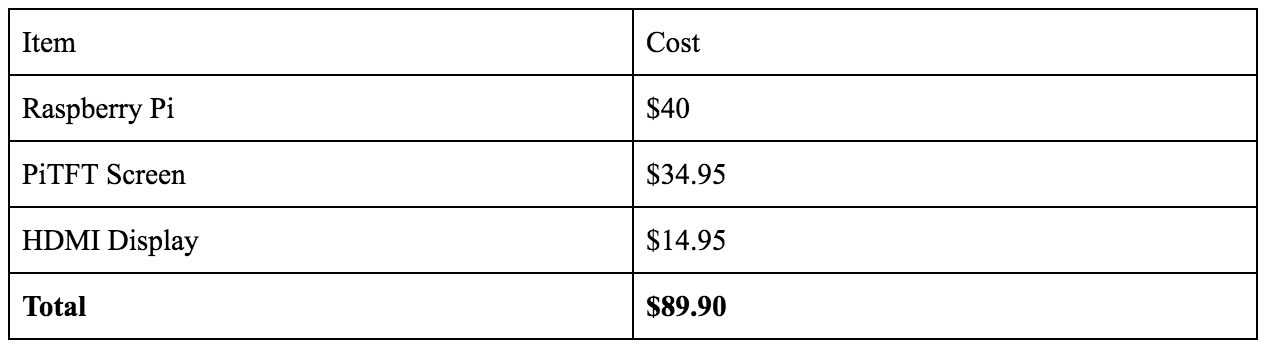
Table 1: Cost of Project Materials
Code Appendix
Shown below are the python and HTML files we wrote for our project.
# Vidya Ramesh (vr236) and Jessica Chen (jc2538); Final Project; May 17, 2018
import sys from socket import *

# Echo client program

var = sys.argv[1]
if '5t' in var or 'waypoints' in var:
    f = open('vid_out.txt', 'w')
    #print >> f, 'next'
    print >> f, sys.argv[1]
    f.close
elif 'F5' in var:
    f = open('jess_out.txt', 'w')
    print >> f, sys.argv[1]
    f.close
elif 'UE' in var:
    f = open('ashlay_out.txt', 'w')
    print >> f, sys.argv[1]
    f.close
<!-- Vidya Ramesh (vr236) and Jessica Chen (jc2538); Final Project; May 17, 2018 -->
<html>
  <head>
    <script type="text/javascript" src="https://www.gstatic.com/charts/loader.js"></script>
    <script src="http://ajax.googleapis.com/ajax/libs/jquery/1.7.1/jquery.min.js" type="text/javascript"></script>
    <meta name="viewport" content="width=device-width, initial-scale=1">
    <style>
    * {box-sizing: border-box}

    /* Set height of body and the document to 100% */
    body, html {
        height: 100%;
        margin: 0;
        font-family: Arial;
    }

    /* Style tab links */
    .tablink {
        background-color: #555;
        color: white;
        float: left;
        border: none;
        outline: none;
        cursor: pointer;
        padding: 14px 16px;
        font-size: 17px;
        width: 25%;
    }

    .tablink:hover {
        background-color: #777;
    }

    /* Style the tab content (and add height:100% for full page content) */
    .tabcontent {
        color: white;
        display: none;
        padding: 100px 20px;
        height: 100%;
    }
    </style>
  </head>

<!-- HTML -->
  <body>
    <!-- Display Tabs -->
    <button class="tablink" onclick="openPage('chart_div', this, 'green')" id="chart_button">Map</button>
    <button class="tablink" onclick="openPage('loc_data', this, 'red')" id="loc_button">List of Locations</button>

    <!-- Tab Content -->
    <div id="chart_div" class = "tabcontent" style="height: 1200px; width: 1800px"></div>
    <div id="loc_data" style="height: 1200px; width: 1800px">
      <br />
      <br />
      <p id="ashlay">Ashlay's Location: undefined</p>
      <p id="voodoo">Voodoo's Location: undefined</p>
      <p id="jess">Jess's Location: undefined</p>
    </div>
  </body>

<!-- Javascript -->
  <script>
    // Options for the map
    var options = {
      showTooltip: true,
      showInfoWindow: true,
      fullscreenControl: true,
      useMapTypeControl: true
    };

    // Array of text files to read location data from
    var files = ["vid_out.txt", "jess_out.txt", "ashlay_out.txt"];
    var count = 0; // Run refresh() once a second until count = 2
    var interval;
    $(document).ready(function() {
      // Get data from text files and call drawMap to display the locations
      // Refresh this function to ensure the map holds updated data
      function refresh(fileName) {
        count = count + 1
        // Each time refresh() is called, read for all files in array files
        $.each(files, function (index, fileName) {
          jQuery.get(fileName, function(data) {
            if (data != "") { // Ensure there is data in the text file
              var loc = data;
              var locJSON = JSON.parse(JSON.parse(JSON.stringify(loc)));

              google.charts.load('current', { 'packages': ['map'] });

      	      if (typeof locJSON.tid === 'undefined') {
                // Waypoint can be used to push current location by name
      	      	google.charts.setOnLoadCallback(drawMap("waypoint", locJSON));
      	      }
      	      else{
              	google.charts.setOnLoadCallback(drawMap(locJSON.tid, locJSON));
      	      };
            };
          });
      	});
        // Increase interval between each refresh once map is loaded
      	if (count > 1) {
      	  clearInterval(interval);
      	  setInterval(refresh, 120000);
      	}
      }
      // Set initial refresh interval as 1 second to load map quickly
      interval = setInterval(refresh, 1000);
    });

    // Keep a dictionary of all users and their JSON location data
    var dict = { '5t':"", 'F5':"", 'UE':"", 'waypoint':"" };

    function drawMap(names, locJSON) {
      // Update dictionary with new location information
      dict[names] = locJSON;
      if (dict['F5'] != "" && dict['UE'] != "" && dict['waypoint'] != "") {
        // Display loations when a user is entering or leaving a new region
      	document.getElementById('ashlay').innerHTML = "Ashlay's Location: " + dict['UE'].desc;
      	document.getElementById('voodoo').innerHTML = "Voodoo's Location: " + dict['waypoint'].waypoints[0].desc;
      	document.getElementById('jess').innerHTML = "Jess's Location: " + dict['F5'].desc;
      };

      // Once all the necessary locations are loaded in, display the map with pinned user locations
      if (dict['5t'] != "" && dict['F5'] != "" && dict['UE'] != "") {
      	var data = google.visualization.arrayToDataTable([
          ['Lat', 'Long', 'Name'],
          [dict['F5'].lat, dict['F5'].lon, 'F5'],
          [dict['5t'].lat, dict['5t'].lon, '5t'],
      	  [dict['UE'].lat, dict['UE'].lon, 'UE']
          ]);
        // Display map
      	var map = new google.visualization.Map(document.getElementById('chart_div'));
        map.draw(data, options);
      };
    };

    // On startup, set the default tab to display the map
    document.getElementById("chart_button").click();

    // Open the correct page based on selected tab
    function openPage(pageName,elmnt,color) {
      var i, tabcontent, tablinks;
      tabcontent = document.getElementsByClassName("tabcontent");
      for (i = 0; i < tabcontent.length; i++) {
          tabcontent[i].style.display = "none";
      }
      tablinks = document.getElementsByClassName("tablink");
      for (i = 0; i < tablinks.length; i++) {
          tablinks[i].style.backgroundColor = "";
      }
      document.getElementById(pageName).style.display = "block";
      elmnt.style.backgroundColor = color;
    }
  </script>
</html>
References
1. Google Maps API Tutorial: https://developers.google.com/chart/interactive/docs/gallery/map
2. Website Template: http://www.free-css.com/free-css-templates/page227/cube