Internet-of-Things Food Management System
Michelle Davies, mdd94 and Myles Cherebin, mac497
05/23/22
Objective: For our project, we opted to build an IOT food management system that keeps track of the quality and freshness of stored foods based on the food itself and the ambient conditions of the storage environment. Based on these parameters, our system indicates, with LEDs, the status of our environment and food, provides an estimated shelf life timeline, and web scrapes the internet for recipe ideas for the stored foods. The goal of this system was to help users better manage their food inventory and plan their meals according to how fresh their groceries are, thereby reducing food waste.
Project Video:
Introduction
For our project, we opted to build an IOT food management system that keeps track of the quality and freshness of stored foods based on the food itself and the ambient conditions of the storage environment. Based on these parameters, our system indicates, with LEDs, the status of our environment and food, provides an estimated shelf life timeline, and web scrapes the internet for recipe ideas for the stored foods. The goal of this system was to help users better manage their food inventory and plan their meals according to how fresh their groceries are, thereby reducing food waste.
Our objectives for implementing this system were to: (1) scan or otherwise detect and recognize the freshness of the food in storage; (2) use such recognition data from (1) to predict its shelf life based on the food while factoring in the temperature, and humidity of the storage environment; and (3) use the data from (2) to suggest popular recipes (using web scraping in Python) which feature those products. After a lengthy development process over the past few weeks, we created a prototype and demonstration which models the functionality of these various aspects of our system.
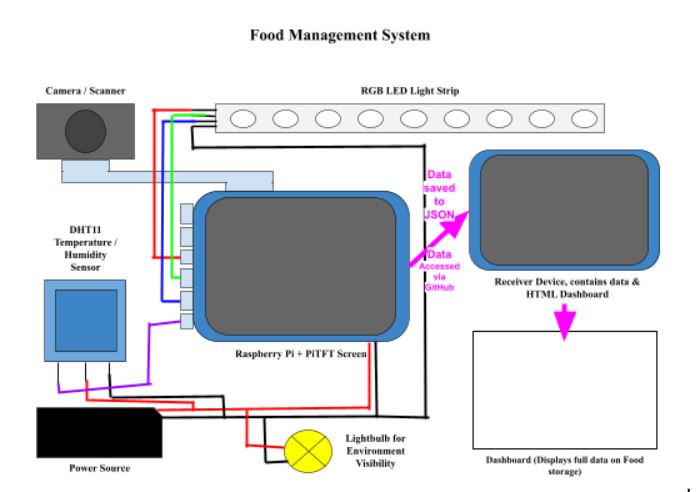
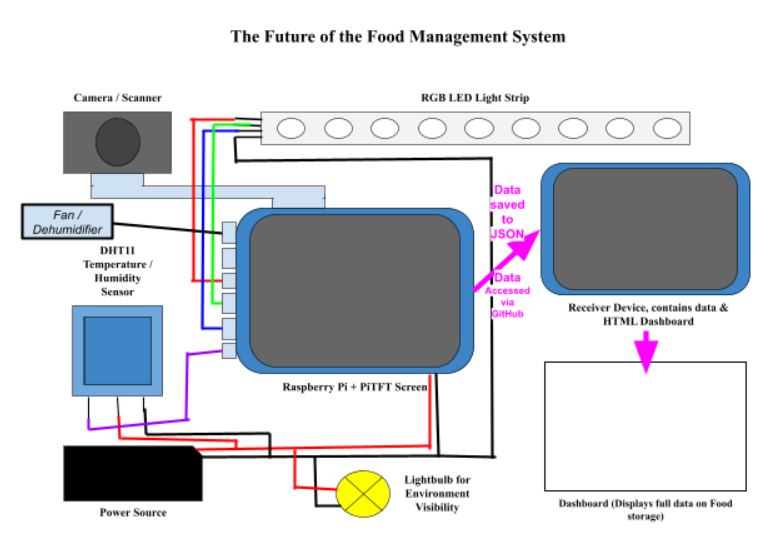
Below is the original, complete hardware schematic of our project, which has mostly remained as shown in our final implementation:
Design and Testing
Temperature and Humidity
We used a DHT11 sensor to read temperature and humidity data about the food's environment. The temperature and humidity data were collected every few seconds and we displayed the values as they updated, on the piTFT screen. The following picture shows the piTFT displaying the temperature in Celsius and Farenheit as well as the humidity percentage.
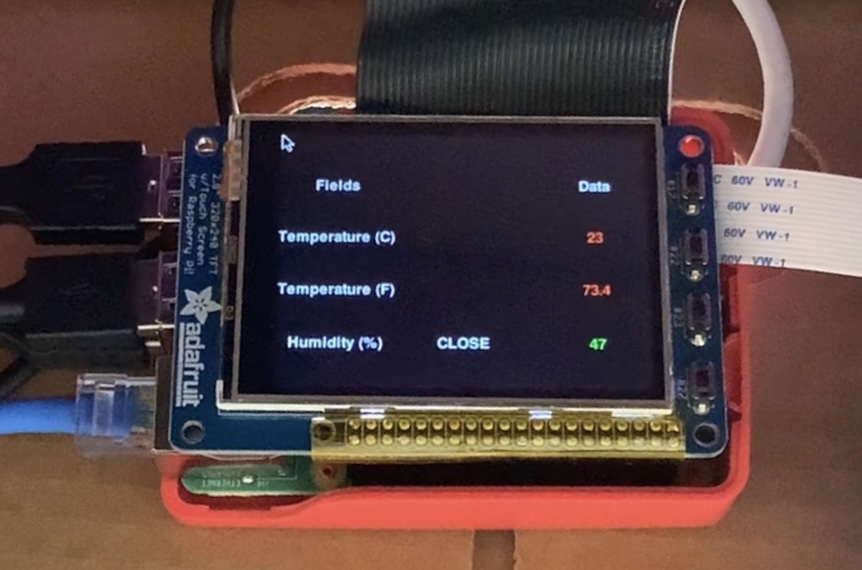
The color of the values tells whether or not the value is within the optimal range. The humidity percentage is green because 47 is within the optimal range of 40 to 60 percent humidity. The temperature values are red because it is a bit too hot, and the values are outside of the optimal range of 50˚F to 70˚F or 10 to 21˚C.
Once the sensor circuit was implemented, we tested it to make sure it worked independently, before incorporating it into the greater system.The figures below show an image of the circuit as well as the circuit diagram.
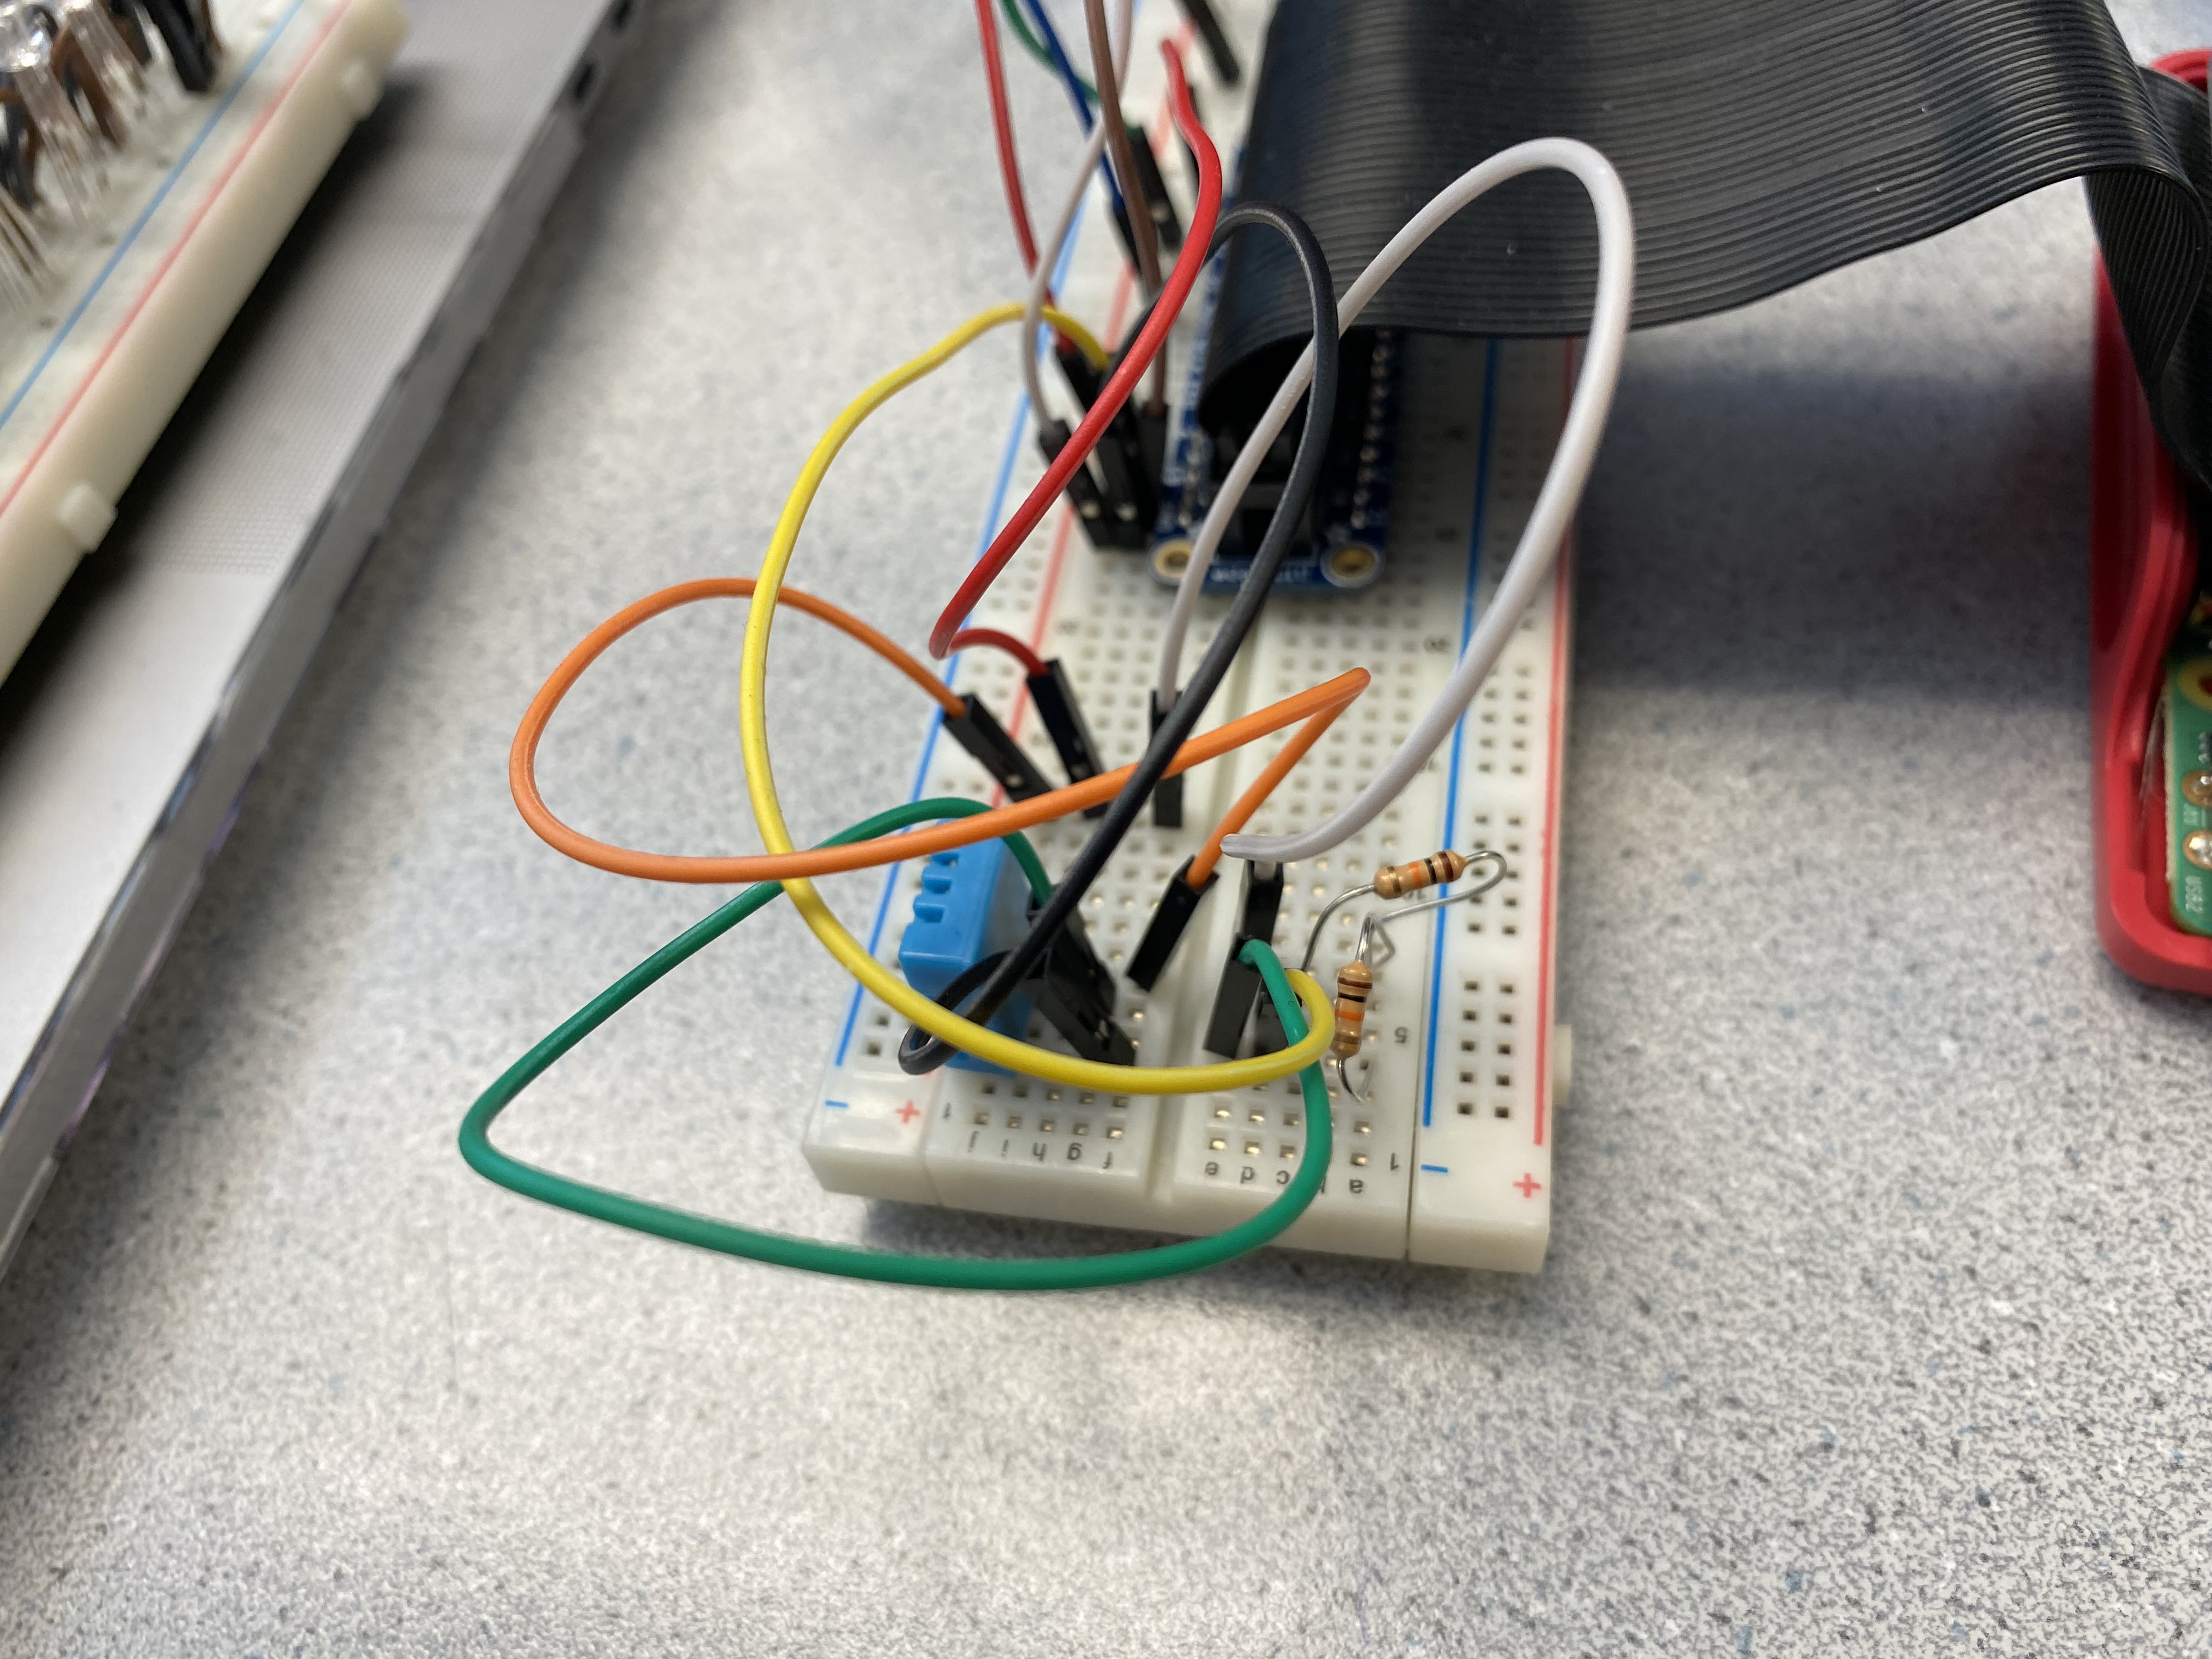
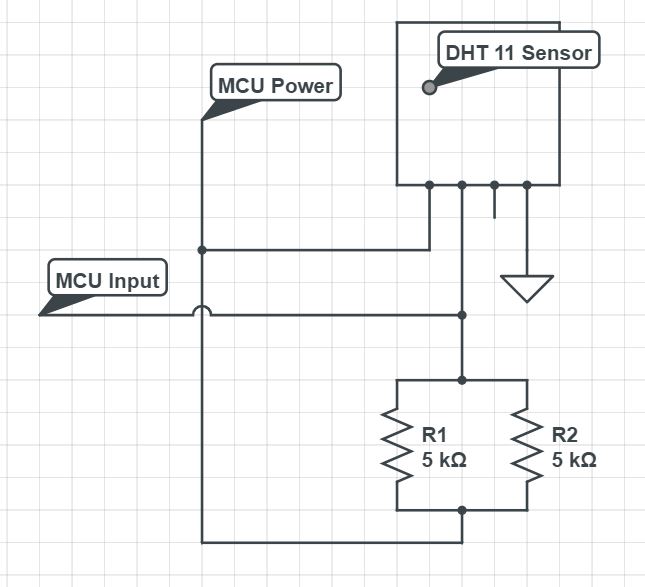
Image Detection
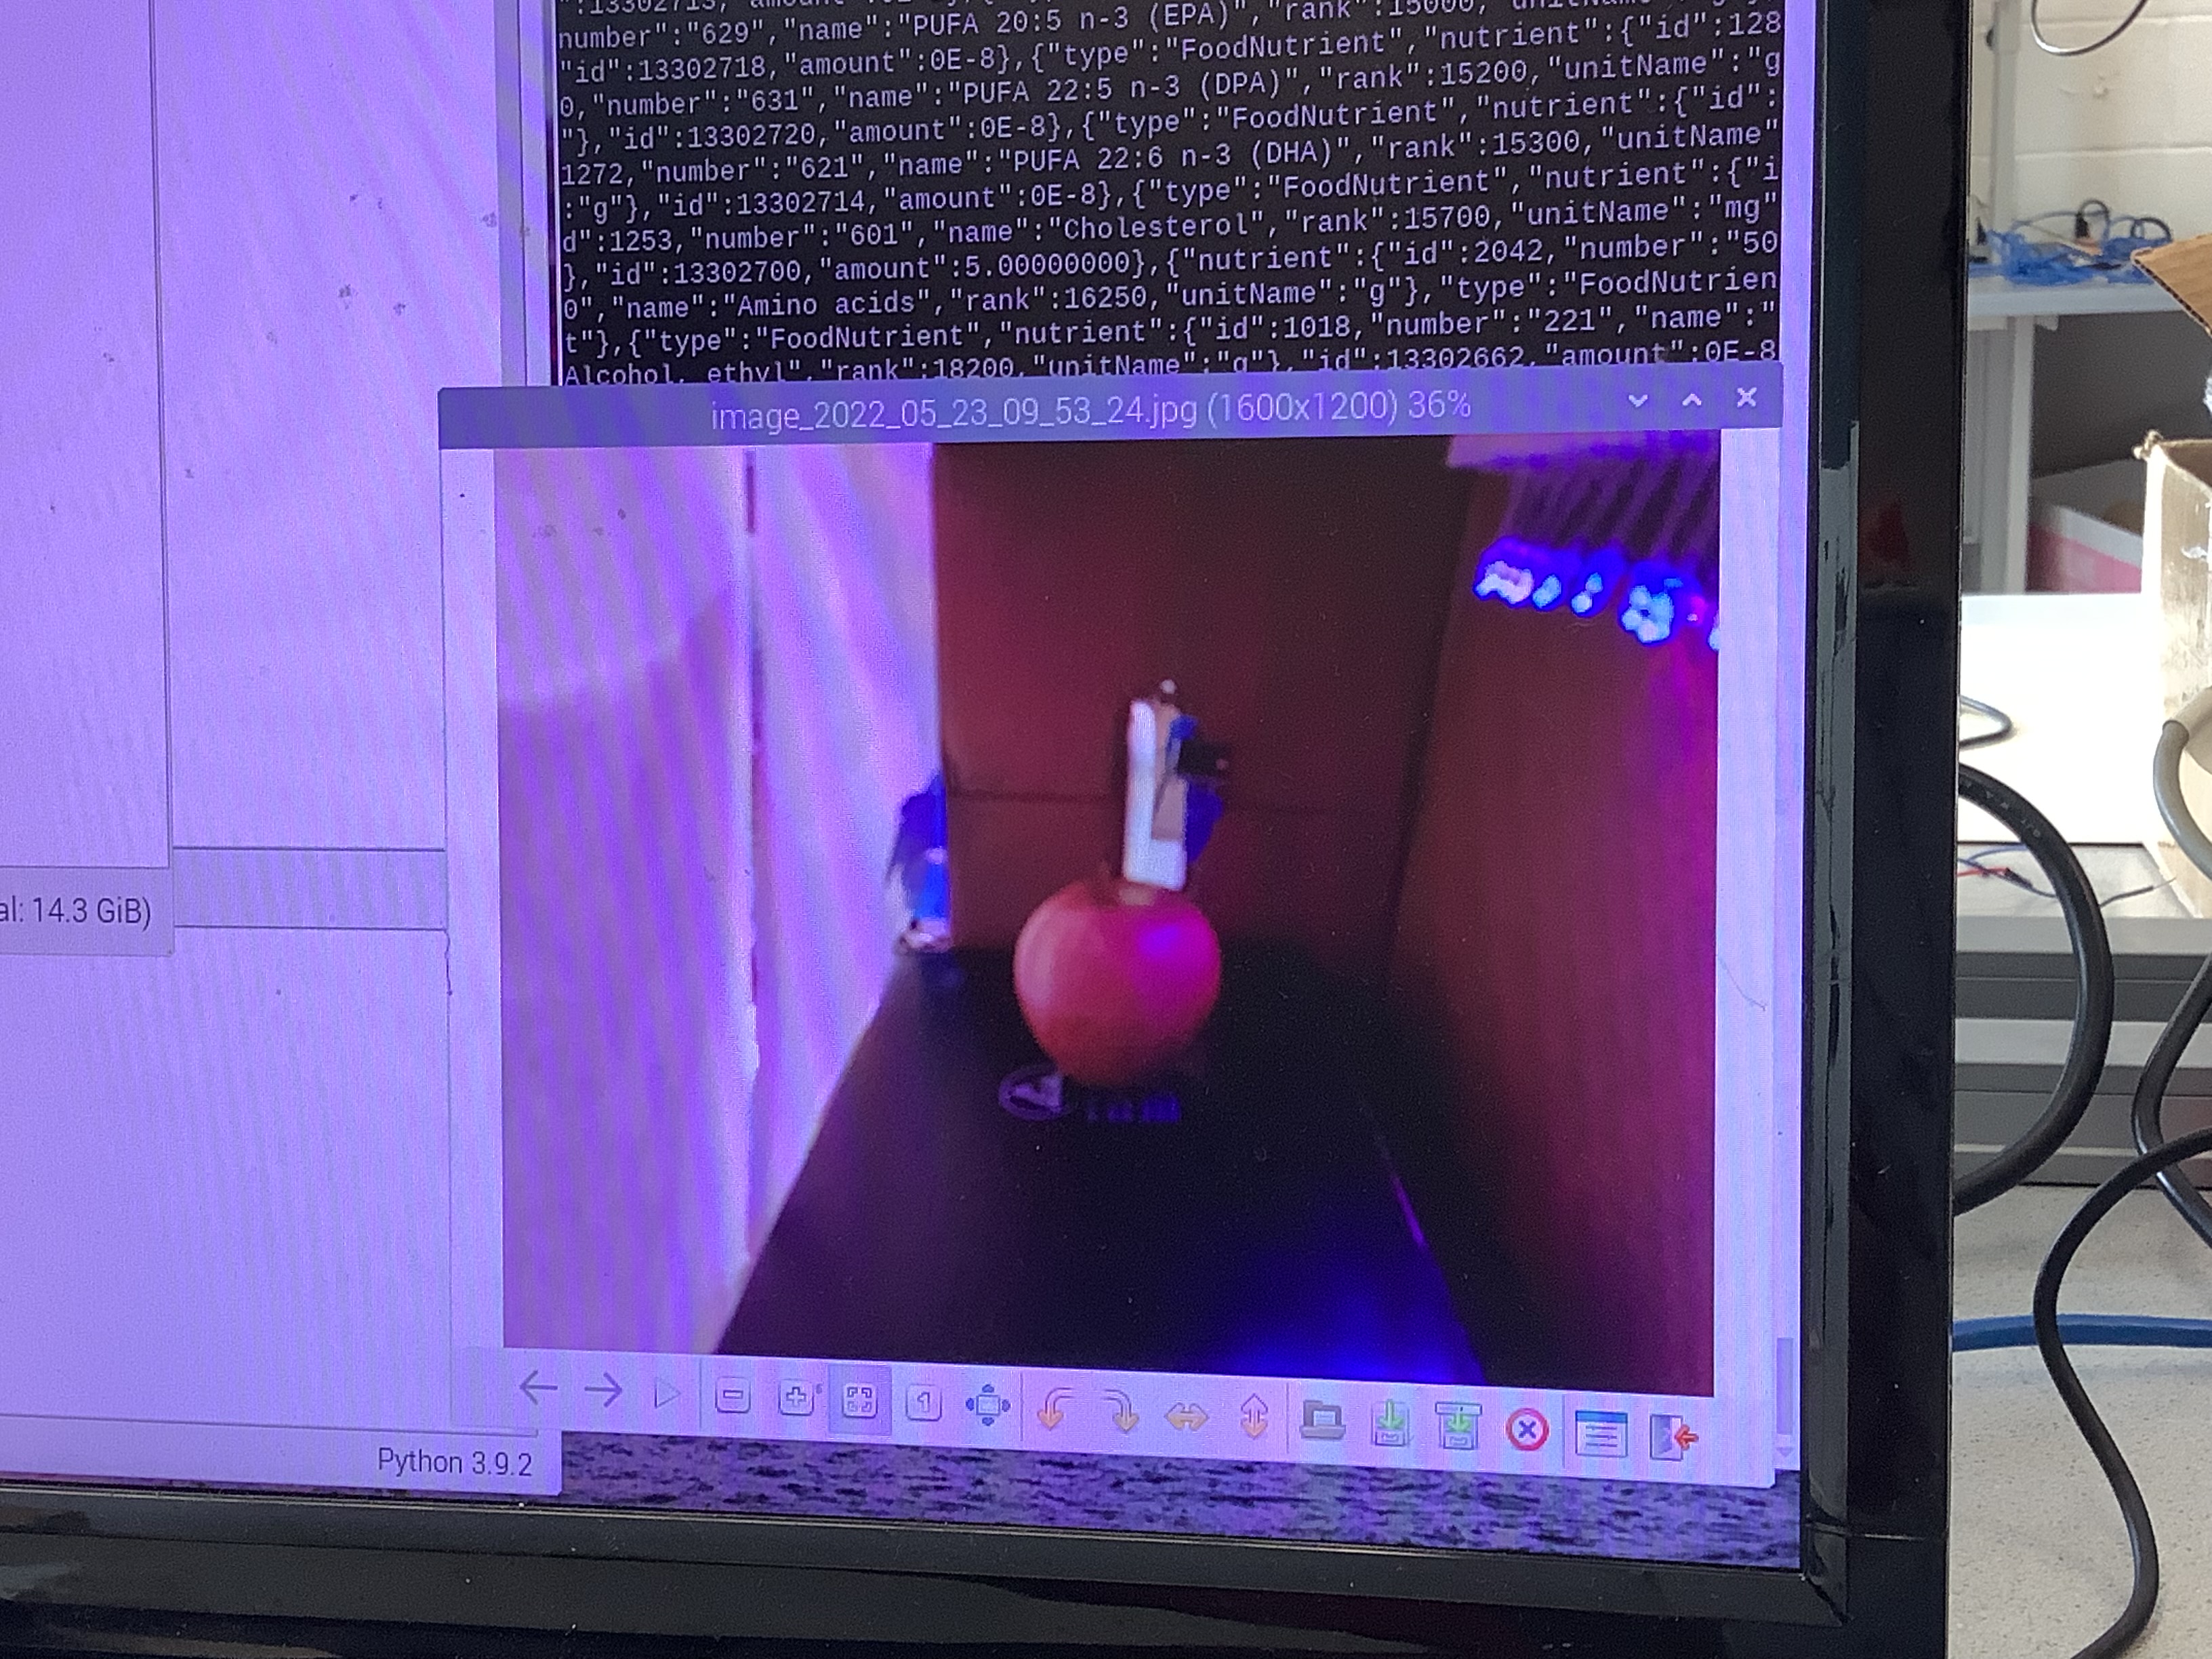
We use OpenCV to perform image analysis on the food in the environment. At the start of the program, the camera takes pictures of the environment. A classifier was trainde to be able to detect the food item. From this image, we used the natural color of the apple to create a mask of just white and black pixels in order to show imperfections in the apple's skin. We discuss this further in the Food Freshness Calculation section.
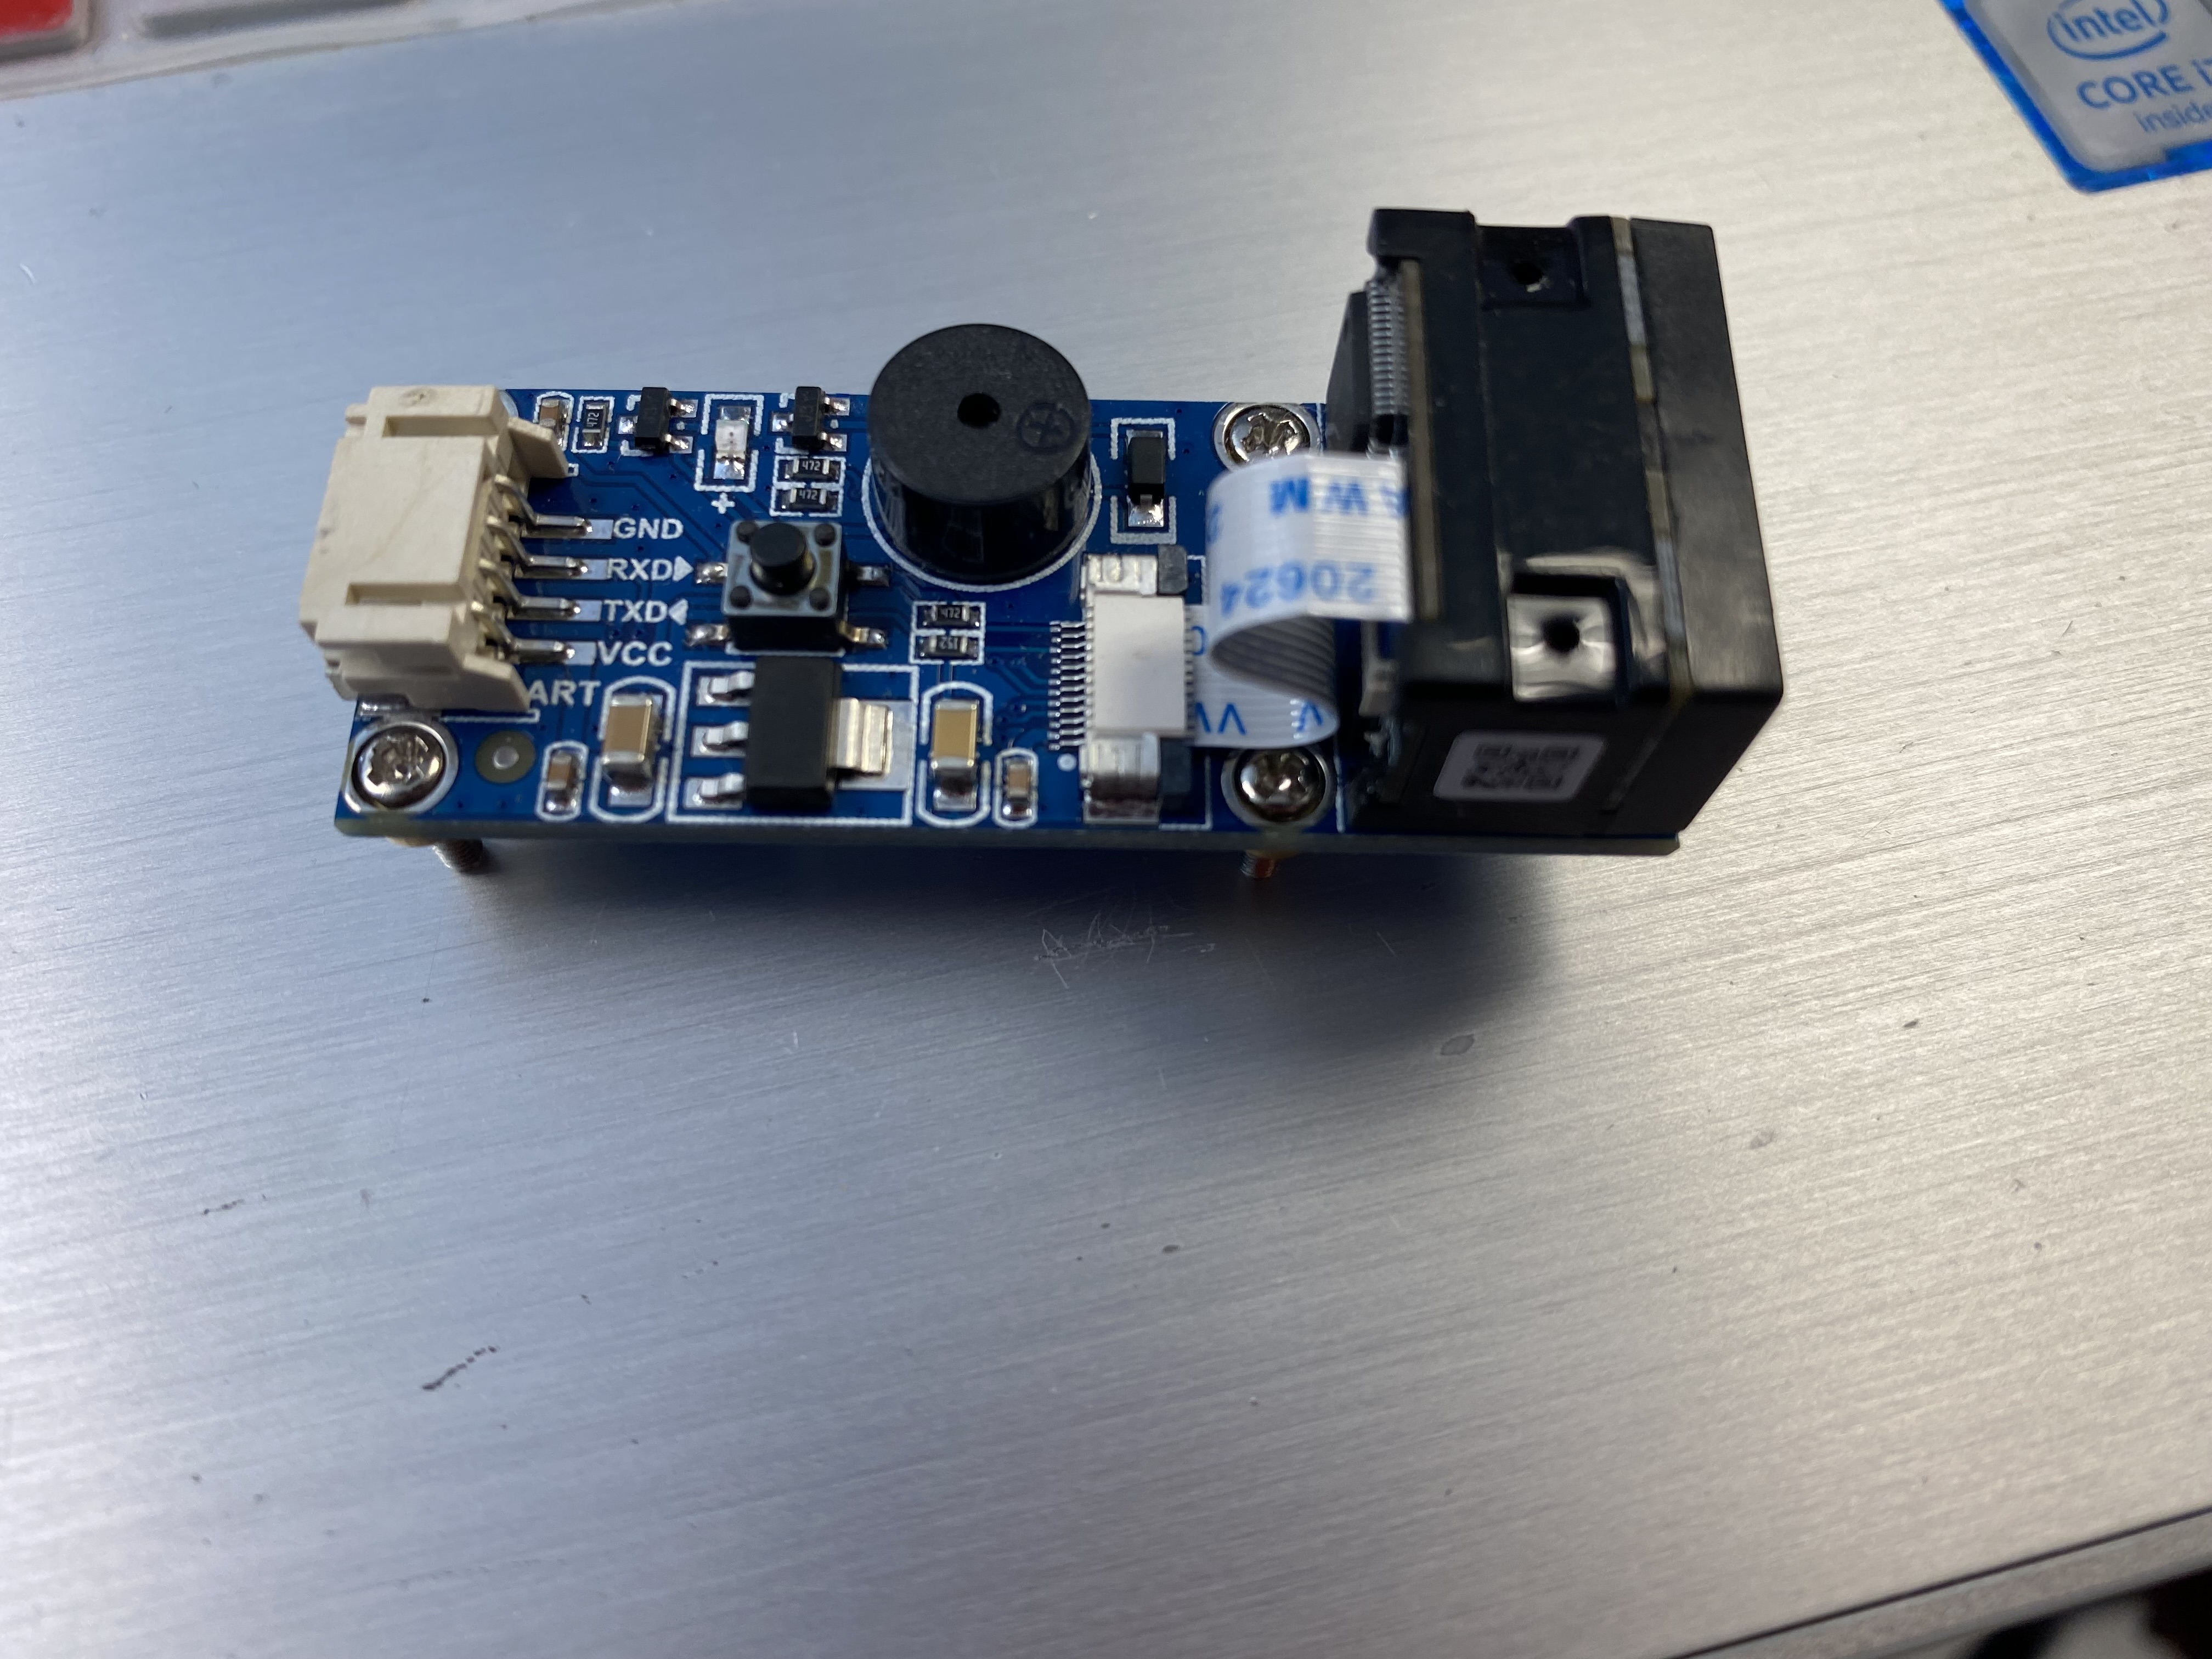
Barcode Scanner
We also wanted to be able to get data from a food item’s barcode. We intended for the user to be able to scan the barcode and receive information about the food’s freshness. With a valid barcode ID, we access an api from the United States Department of Agriculture with all of the food information. We are able to produce a measure of freshness for the food using the publication date found in the food’s data.
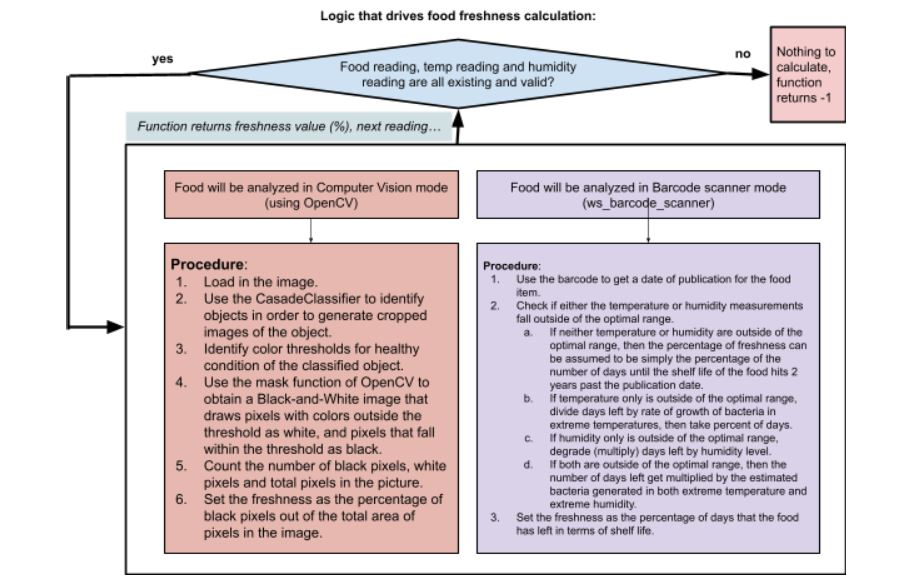
Food Freshness Calculation
Based on the two different modes in which this system scans for food items to analyze, the program calculates the freshness of the food using the data gathered about the food and from the ambient temperature conditions. Below is a decision tree for the freshness calculations performed on the food.
Results
The development process overall worked for allowing us to yield accurate results after weeks of configuring and training our system to correctly identify and analyze given food items either in barcode scanning mode or in Computer Vision mode, depending on the data collected on what type of food is present in the system.
In the process of developing our system and preparing for our demonstration, we hit a roadblock where our Raspberry Pi unexpectedly got fried the night before our original demonstration time was set to take place. Although we were able to recover a lot of our code thanks to having a lot of our work transmitted via Github, we lost a lot of our progress on the hardware configuration of our system and training our Computer Vision with the fruit recognition data that we did over the past few weeks. As a result, Professor Skovira gave us some extra time to recover as much as possible and gave us a replacement Raspberry Pi device, so we scaled down the scope of our prototype by tabing the TCP transmission for a future iteration of the project and solely using Github to share the JSON file(s), and reducing the range of foods that the system was equipped to handle. GitHub also stopped working at some point as we were trying to reestablish our ability to connect to the internet on the new Raspberry Pi. So for some tests, we were manually uploading our data to Google Drive to be accessible remotely, in the same fashion as storing data on a Cloud server. Additionally, we opted to demonstrate all of the parts manually rather than allow our program to run through the transmitter to the receiver independently because of the loss of stability with the transmission process. Finally, we had to demonstrate the barcode scanner analysis functionality independently by scanning for a code and passing the code to our barcode analysis function manually because the new Raspberry Pi could not find the address of the serial USB connection to the barcode scanner so input into the Python program even though it was detecting the barcode scanner enough to display the code in terminal.
Here are a couple of sample data packets that we have collected from running this program:
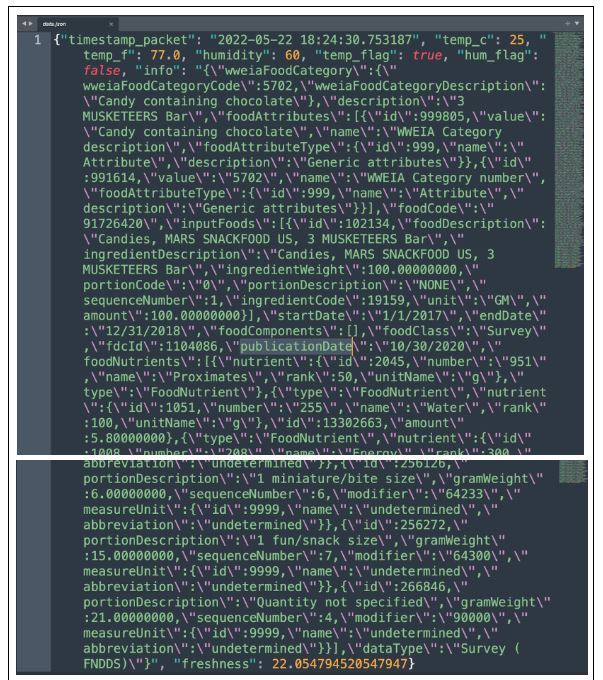
In terms of the software, the transmitter is interpreting, collecting and saving the following data for all food identified in the system (i.e. the Information for Recognized Food (name/type), the Current Freshness of Food, the Ambient Temperature of Demo Environment, the Ambient Humidity of Demo Environment, the Temperature Threshold Flag and the Humidity Threshold Flag). The transmitter can obtain the Information for Recognized Food (name/type) and the Current Freshness of Food for both Computer Vision and for a scanned barcode.
For the hardware, our criteria for success has widely been met as well. First of all, the transmitter is outputting a calibration light signal to indicate that data is being transmitted to the receiver. The transmitter is also outputting the light signals for the environment if the temperature lies outside of 30% of the standard room temperature range (“Temperature Threshold Flag”), as well as the light signals for the environment if the humidity lies outside of 30% of the standard room humidity range (“Humidity Threshold Flag”). In addition to this, the transmitter displays the Ambient Temperature of the Demo Environment, Ambient Humidity of the Demo Environment on its PiTFT Screen, with the data color coded to indicate the threshold. Finally, the transmitter saves the data in a JSON format that may be transmitted to a receiver device.
The receiver’s software application is also set up to be able to interpret, collect data via connection to a GitHub repository when running, and format the following data in an HTML webpage once data has been transmitted. Specifically: (1) All data sent from the transmitter in the form of a data report, (2) the Estimated Shelf Life of Food based on Current Freshness of Food, Ambient Temperature of Demo Environment, Ambient Humidity of Demo Environment, Temperature Threshold Flag, and Humidity Threshold Flag has been calculated and inputted into the resulting html page, and (3) Popular Recipes for Food by Python web-scraping based on Information for Recognized Food (name/type) appear in the html page as well. Unfortunately, our Github connection was having an issue with connecting to our new Raspberry Pi at the time of our demonstration.
Conclusions
To say the least, the circumstances around losing key aspects of the hardware configuration of our project, as well as some of the project’s software features like the files we used to train our Computer Vision algorithm to recognize foods for analysis, the configuration settings of the Barcode Scanner, and the TCP connection were catastrophic for the progress of our project. However, we were able to make up for lost time and establish a demonstration of the proof of concept for our system. Many of the features that we maintained for our demonstration will prove to be useful for gathering key data for food freshness, and we have very much established a solid foundation on which the project would be able to be expanded upon.
Regardless, we maintain our belief in the potential of this system to make a difference in terms of helping to alleviate prevalent issues in food security. By understanding how the quality of food changes over time given the ambient conditions of its storage environment, we can take steps to ensure that the storage unit maintains an optimal ambient environment so that food can be preserved for people who really need it, and so we see a decrease in local food waste.
Future Work
As mentioned previously, we see an enormous amount of potential in the success of this project given additional time and resources to invest in further research and development.
Inspired by our Raspberry Pi being fried, one addition that could be made is to have the program determine if there is enough memory available on the system to run to completion, and log memory usage of the program in an error log.
One improvement that we would make is decreasing the amount of photos that the machine takes at runtime in order to reduce latency in the program. To do this, we can stick to one photo being taken rather than 10 per run. Another option would be to set the camera to take a photo of the environment on a regular schedule as a background process, and then analyze the latest photo only. Although, having some extra copies can be useful in the future to implement functionality to choose the best photo.
One of the future opportunities for expansion that we see for this project is for expanding its food recognition capabilities. Due to the fact that we have set up two modes of food recognition (via Computer Vision and Image Analysis of the PiCamera and via barcode scanner), we have two modes by which we can expand on the project’s ability to recognize levels of freshness across a greater variety of food items. In terms of the Computer Vision (“CV”) aspect of the project, there’s is room for us to train the algorithm to recognize a greater range of fruits and vegetables, and then use the standard color extremes of a healthy version of each of these foods to determine the threshold values that will be used to mask the image and determine by view what the freshness of that particular food is. Additionally, we can expand by training the CV to recognize the text on the containers of canned foods so that in the event that a scanned food item cannot be found in the records of the USDA database, we can have the program all another CV function to read the text of the box and use that to search for the food’s properties in the USDA database in order to estimate an expiration date.
With the barcode scanner, the Python program that we wrote lost connection to the serial address of the barcode scanner and cannot find it, so the the scanner does work, but it does not route the input correctly for our logic to run to calculate the freshness and information of the food being scanned. Because we know that the logic we have written for parsing the database works, the input of the code is something that we would work on fixing; we could potentially have the Bash script search for the address automatically and then input it as an argument to the Python script.
Combining the previous two points, there is potential for this system to support the detection and analysis of multiple food items in multiple modes at once: using the ws_barcode_scanner library in Python, we can keep a set of all unique barcodes scanned, refreshing this set on initialization of the program, and then iterate through analyze this set’s information along with the detected Computer Vision objects on each individual run of the program’s main while loop.
Another goal that we were set back with due to the circumstance of having of Raspberry Pi System become fried and having to replace and reconfigure it at the last minute was to have the system run asynchronously and transmit the data from the *.json file live via TCP to one of our computers or devices so that the code for the receiver to automatically process and format the data into an HTML file automatically. As it stand right now, we can have the data run automatically and save as a json file, and then once the files are made available on Github (either via the automatic command we wrote to push it or by manual upload to Github), we can run the receiver code on demand on the device of our choice via a local instance of the repository in order to generate and view the resulting HTML files. A future goal would be to reestablish a stable TCP connection that can be opened by the transmitter program automatically to transmit the data to the correct address. Then, we can have a designated receiver device that constantly runs the receiver code to update the dashboard automatically and then hosts that html dashboard on the Pi.
Another potential avenue that can be taken with this project is to set up an actuator at the receiver that can work to restore the ambient conditions of the storage unit to normal. For example, the program as it stands alerts the system via color change of the monitoring text on the PyGame Screen when the ambient conditions of the storage unit are not optimal for food storage. This can be built upon so that the same condition that triggers this warning also turns on a built-in fan and dehumidifier to bring temperature and humidity back down to their optimal values.
Finally, a future improvement that could be made to this system is to set up the barcode scanner with a mechanical arm that can move around to look for scannable barcodes in different locations in the box environment, so that they do not have to be positioned in one stationary line of scanning
Budget/Parts List
- Pi Camera - $ 29.95
- Barcode Scanner Module - $39.99
- DHT11 Sensor - $5.00
- RGB LED * 20 - $3.95
- Cardboard Box - $0.42
Total Project Cost: $ 79.31, $ 20.69 remaining in budget.
References
Transmitter
International Research Journal of Engineering and Technology (IRJET)
FRUIT QUALITY DETECTION USING OPENCV/PYTHON, May 2020
e-ISSN: 2395-0056 Volume: 07 Issue: 05 | May 2020 www.irjet.net p-ISSN: 2395-0072
Barcode Scanner DocumentationFood Freshness Calculation Sources
LiveStrong Food Storage Conditions How Temperatures Affect Food Exponential Growth FunctionFood Computer Vision Analysis Resources
Hackster.io Medium.com Python Documentation Educba.com Developpaper.com Fruit Freshness DetectionReceiver
FoodData Central API Guide Data Plotting Web Scraping (for recipes)Code Appendix
All of our code can be found at this GitHub Repo
Work Distribution
In terms of the work distribution in the beginning, Michelle worked on a lot of the development of the project’s logic and actualization, while Myles focused on testing the hardware and software features for the project’s functionality. Towards the end, Myles focused more on testing the Computer Vision and Barcode analysis while Michelle focused on the Bash scripting and the data-saving/transmitting process. However, we were not restricted to these roles and we would often work on different project components and work jointly as the situation called for it, especially when we had to replace our Raspberry Pi and therefore reconfigure a majority of the project setup. The rest of the project (the writeup and demonstration) were done collaboratively.