Software Design
State Diagram
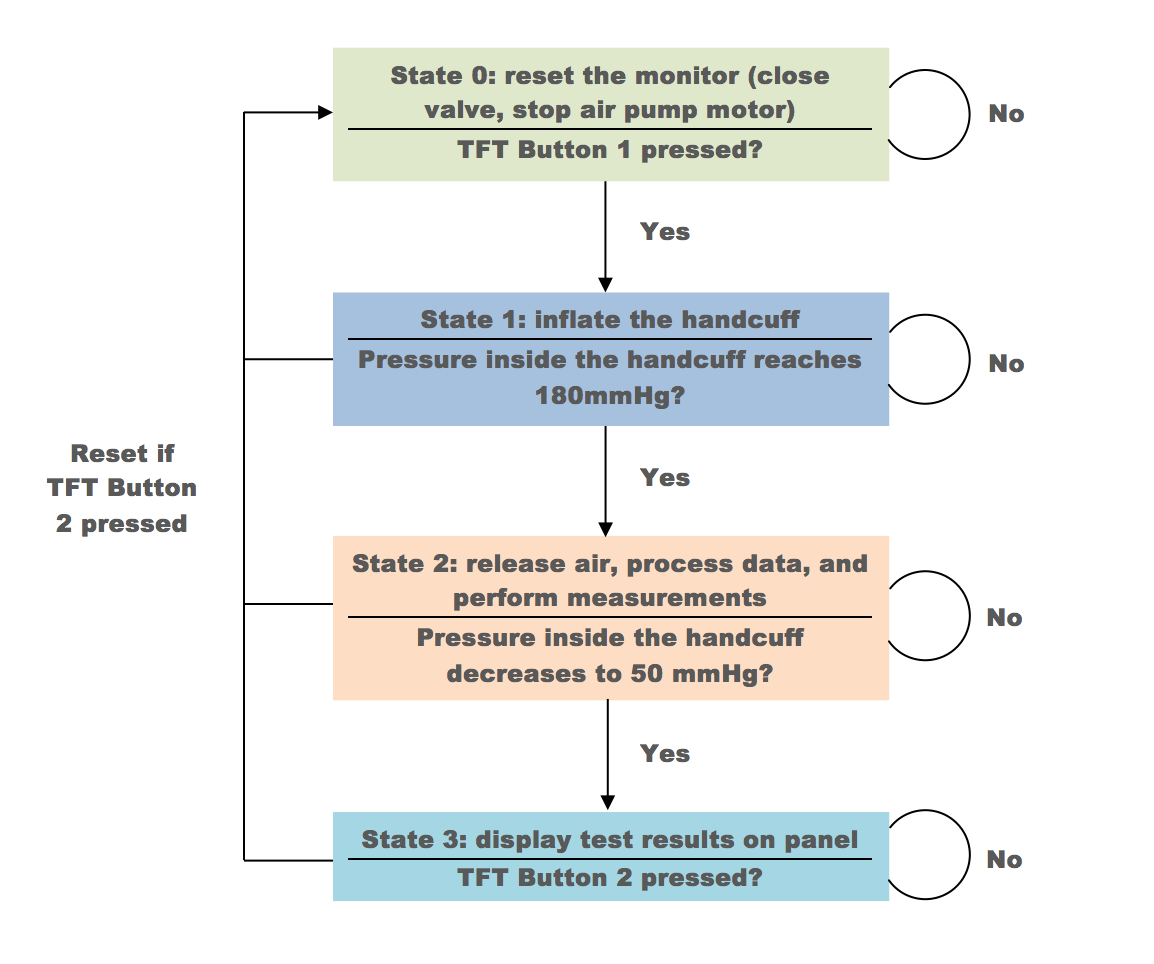
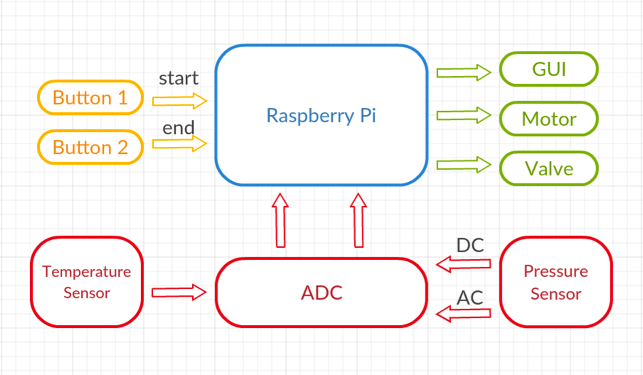
The health monitor control system is consisted by 4 states:
1) State 0: the reset state, ensuring the health monitor is in the sleep mode before starting measurement. The air pump motor is stopped and air valve is open, so that no air can be pumped into the handcuff in any situation. When the first button on the TFT is pressed, the system will move to state 1, otherwise, loop in state 0.
2) State 1: start inflating the handcuff until the pressure inside the cuff reaches 180mmHg. Once the pressure is high enough, the system will move to state 2. If emergency happens, the second button on the TFT can be pressed at any time to release the air immediately by resetting to state 0.
3) State 2: the core state of the health monitor, having a relatively heavier workload than other states. In this state, the handcuff starts to release air slowly through the voltage control air valve. Meanwhile, the program will read signal from ADC, process the data, compute the heart rate and blood pressure, and also send the raw data to an output file for the future use of visualizing heart pulse. When the pressure inside the cuff decreases to 50mmHg, at which point all the measurements are done for most people, the system will jump to state 2.
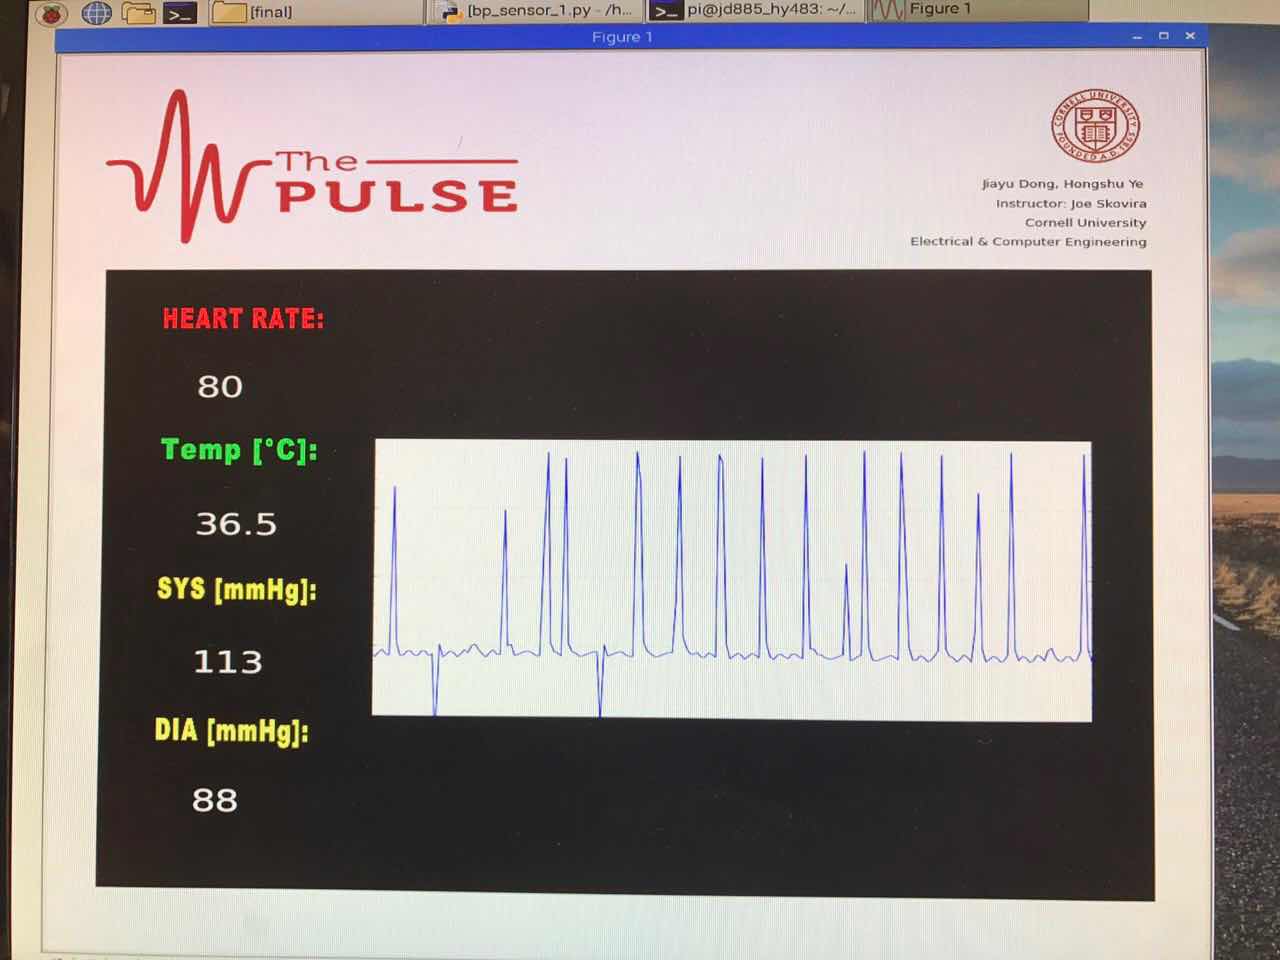
4) State 3: measure body temperature, display test results on the panel, and visualize heart pulse. Most measurements are completed in state 2, except body temperature. Once the body temperature is obtained, all the test results will be displayed in the panel. And, in this state, heart pulse visualization will be performed. Heart pulse visualization is time-consuming because it really takes some time for Raspberry Pi to animate he heart pulses and to draw them in a single plot. After the cardiogram is completed, the system will stay in state 3 unless the reset button or quit button is pressed
Analog-to-Digital Converter
MCP3008
The MCP3008 is 8-channel 10-bit analog to digital converter, which is greater for just reading simple analog signals, like from temperature sensor. In our first attempt, we tried to use MCP3008 for both temperature sensor and pressure sensor. Later we found that MCP3008 works perfectly fine for detecting signal from temperature sensor, but not for heart pulse detection through the pressure transducer, which need to be very sensitive and requires more bit to get a more accurate data. So, we keep the MCP3008 for temperature measurement and move on to ADS1115 for blood pressure measurement for a better result.
We develop a 100-line python script to read data from MCP3008, which is listed in the Code Section. The logic is to read SPI data from MCP3008 using four GPIO pins: SPIMOSI, SPIMISO, SPICLK, and SPICS.
ADS1115
The ADS1115 are great analog to digital converters that are easy to use with the Raspberry Pi using its I2C communication bus, which is a higher precision 16-bit ADC with 4 channels. The 16-bit signed integer value can represent decimal number form 0 to 32767. Since the ADS1115 is supplied by 3.3V from Raspberry Pi, 0 and 32767 are corresponding to 0 and 3.3V.
We need to install the Adafruit ADS1x15 Python library from the source on Github. The library is installed by running the following commands in the terminal.
sudo apt-get update
sudo apt-get install build-essential python-dev python-smbus git
cd ~
git clone https://github.com/adafruit/Adafruit_Python_ADS1x15.git
cd Adafruit_Python_ADS1x15
sudo python setup.py install
To use the ADS1115 in our Python program, we import the Adafruit_ADS1x15 and create an ADS1115 instance, adc = Adafruit_ADS1x15.ADS1115(). Then data can be read from the selected channel x, data = adc.read_adc(x, gain=GAIN), where x is a integer from 0 to 3.
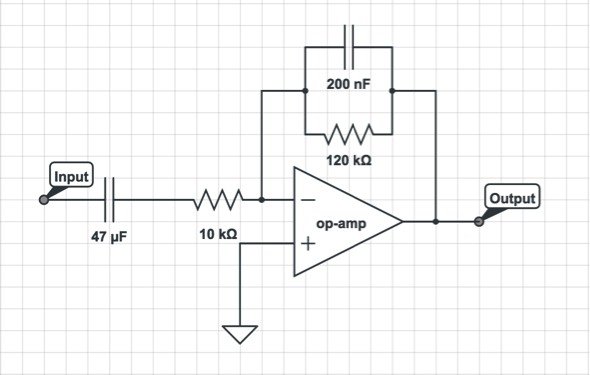
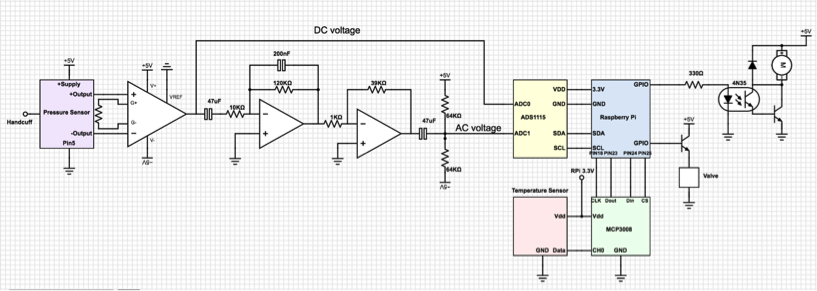
In our case, the dc voltage represents the pressure inside the handcuff is read from A0, and the ac signal indicates the heart pulse is read from A1.
Motor and Valve Control
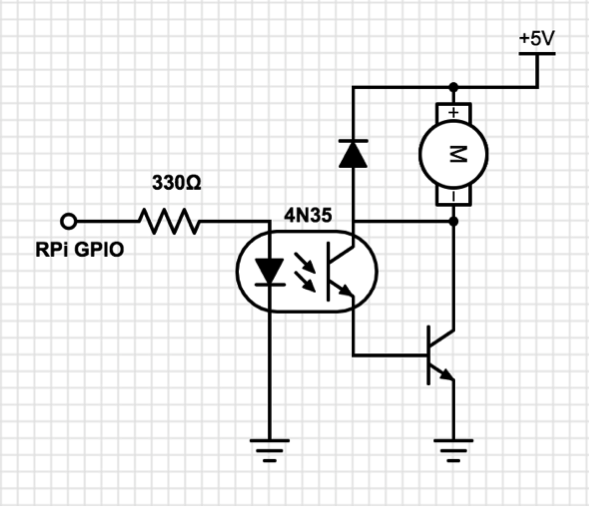
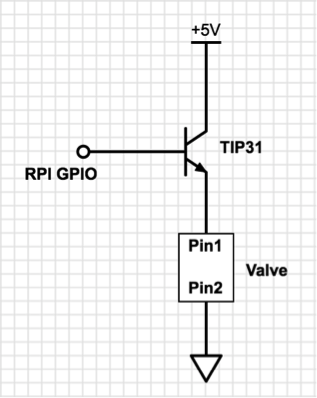
The motor and valve are both controlled by Raspberry Pi. They are connected to two NPN transistors, and the base pins of the transistors are connected to GPIO 21 and 16. When GPIO is in high state, motor is activated and valve is open.
One problem with our air valve is that it only has two states: open and close, which means the valve cannot control the airflow. If we set the valve to open during state 2, all the air in the handcuff will be released in just a second. The process is so quick the pressure sensor or the Raspberry Pi cannot capture that heart pulse signal. To solve problem, add some code to our program to let the valve release air every 4 seconds, and the duration is 0.05 second per time. By doing this, the handcuff deflates slowly.
Another problem of deflating the handcuff is that air deflation influences the pressure inside the handcuff. Because of this, during the 1 second after the valve stops releasing air, the pressure inside is unstable producing noisy data that blocks the real heart pulse signal. So, we make the program sleep for 1 second to allow the pressure inside the cuff return to a stable state and then read data from ADC. The pseudo code for valve control is shown below.

Body temperature measurement
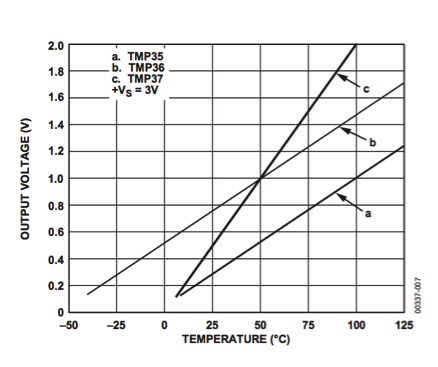
TMP36 is the temperature sensor in the monitor system. TMP36 generates an analog signal that is linearly proportional to temperature. The temperature range is from -40 degrees C to 150 degrees C and the output range: 0.1V (-40 degrees C) to 2.0V (150 degrees C). We use MCP3008 to convert the analog signal from TMP36 to digital signal for Raspberry Pi. Since MCP3008 is power by 3.3V by Raspberry Pi and has 10 bit, which correspond to 1024 in decimal, 1 bit indicates 3300.0/1024.0 mV. Then, we convert the digital signal to temperature in Celsius using the following equation.

The temperature reading from TMP36 will be stable after about 10 seconds, so we put the sensor measurement in the main while loop and display the final temperature with heart rate and blood pressure on the panel at the same time.
Heart rate measurement
During the measurement, heart pulse appears right after systolic pressure and disappears before diastolic pressure. Heart pulse pumps the pressure inside the cuff oscillates, which consequently causing the data read from ADC oscillates as well. The following figure shows the processed AC output signal indicating the heart pulses detected by the pressure sensor.
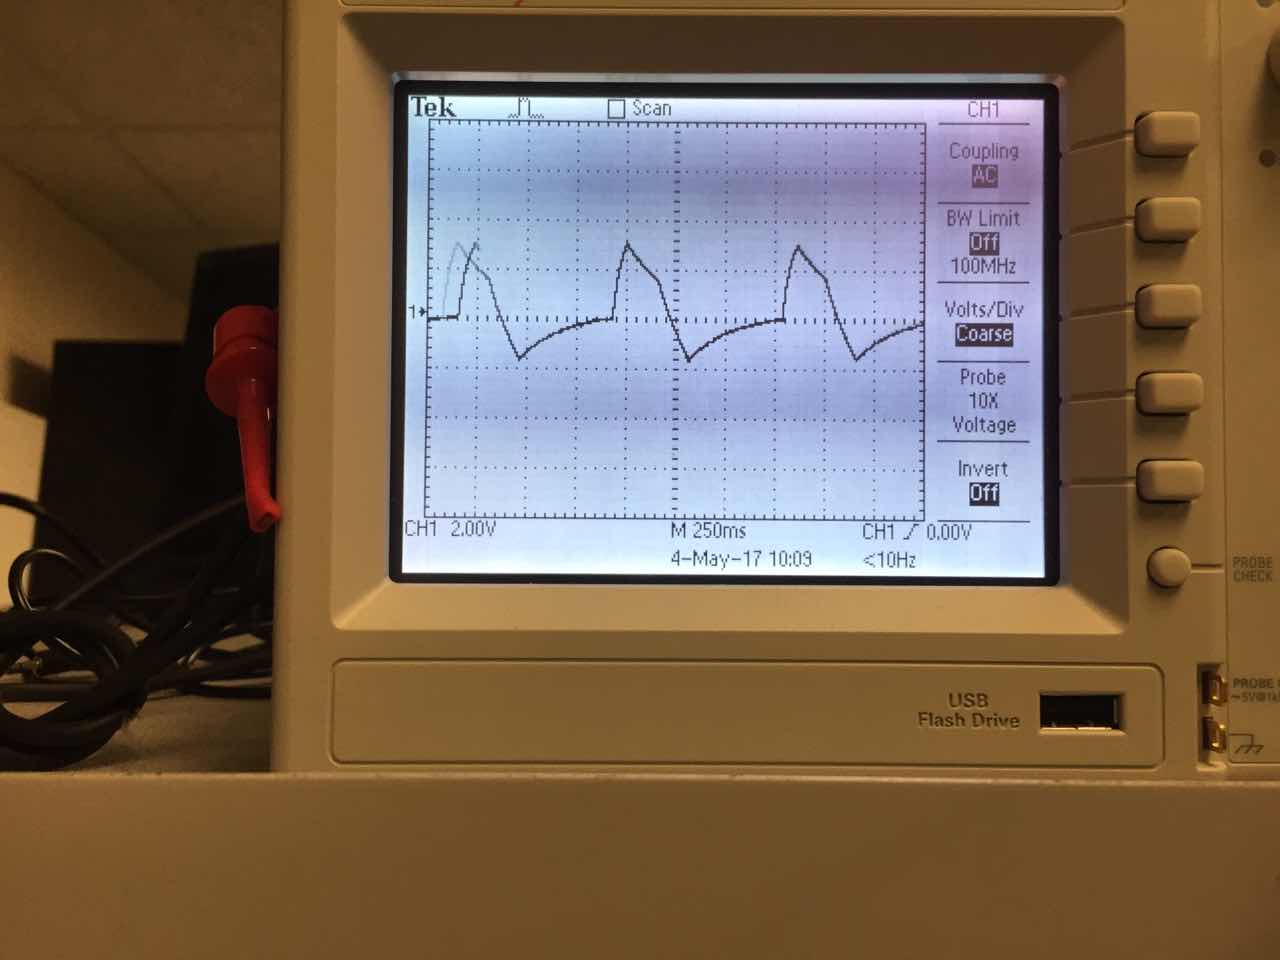
As shown in the figure, the waveform is very sharp, which represents the heart pulse clearly. This figure is capture when the heart pulse is steady and relatively strong. But, in fact, the intensity of heart pulse varies from different time intervals. When the heart pulse just appears, the signal may fluctuate because the force from the handcuff can still occlude the artery, preventing blood flow. So, some weak heartbeats may not be detected. After the pressure inside the cuff decreases to some level, most heartbeats are strong enough to be detected and their digital signal can reaches to a level over 25000 from ADC. The steady state often starts after 15 seconds from the beginning of measurements.
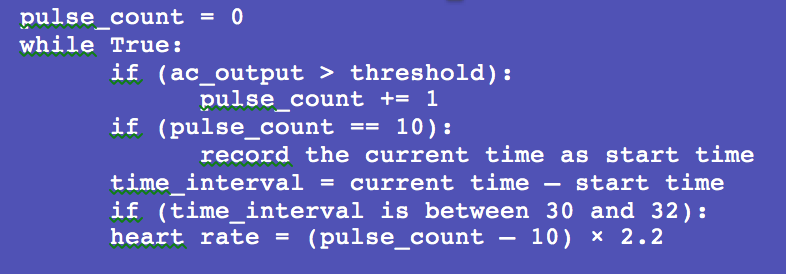
In the code, we choose the time interval where the waveform oscillation is strongest. We define the interval starts after 10 heartbeats have been detected. And then count the heartbeats for 30 seconds, the heart rate can be calculated by multiplying 2 to the count of detected heartbeats. In reality, not all the heartbeats can be detected, so after calibrating, we found multiplying 2.2 is reasonable to get a relatively accurate result of heart rate. The following pseudo code shows the basic logic of heart rate measurement.
Blood pressure measurement
As we mentioned in the previous section, systolic pressure is measured when the first heartbeat appears and diastolic pressure is measured when heartbeat cannot be detected completely. The logic is simple, but, in fact, we still need to deal with noisy data. Since the pressure sensor is very sensitive, even a small movement of the user can generate a big noise that looks like a heartbeat appears, which will decreases the accuracy of test result dramatically. To minimize the influence of noisy data, our program outputs systolic pressure when 3 heartbeats have been counted, and diastolic pressure when the number of non-pulse data is greater than 40, which is equivalent to 40×0.05 second = 2 seconds. The pseudo code is shown below.

Heart Pulse Visualization and User Interface
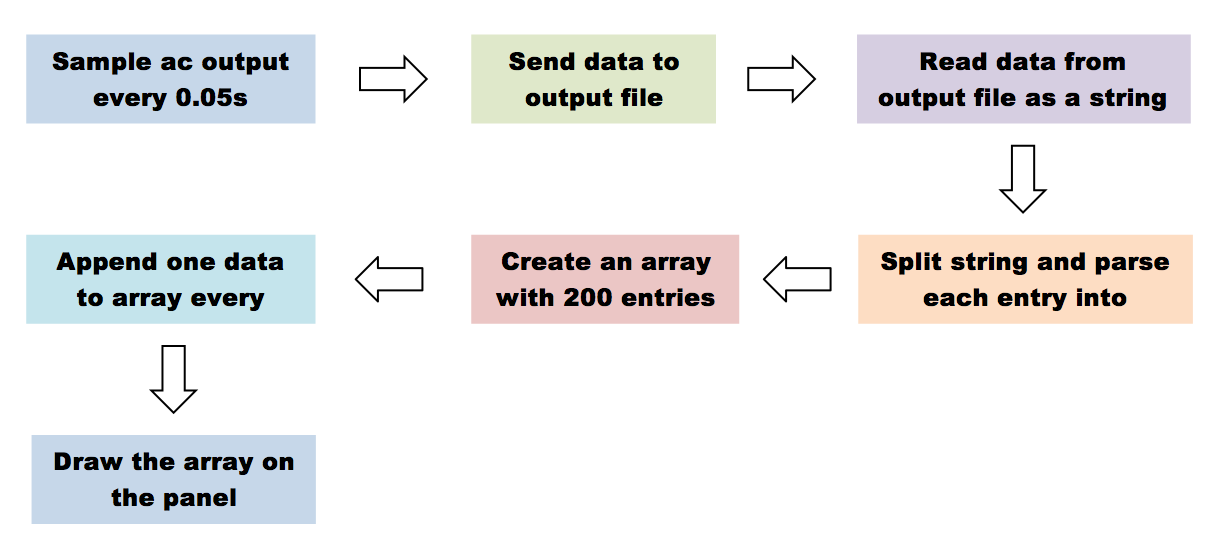
At the beginning, we tried to visualize heart pulse in a real-time manner. But, we cannot find a proper Python library that can perfectly support this function. We tried Plotly, a paid visualization tool that is good for creating chart and scientific graphs. Plotly can achieve real-time data sensing, but the drawback is that it is an online tool, so graph can only be displayed on browser. Then, we moved to matplotlib, a plotting library for specifically for Python and its numerical mathematical extension Numpy. The animation of heart pulse can be achieved by using animation function inside matplotlib, but this function blocks the execution of the program. After trying many possible methods, we still cannot solve the problem. Then, we found drawing data on the panel using matplotlib is really a heavy work. No matter how hard we tried to speed up the execution, the drawing process is still slow and blocks the data reading from ADC. To let the data can be read smoothly, we decide to read and process data only in state 2, and visualize the heart pulse in state 3. In state 2, data is sent to an output file that is read later in state 3 for visualization. The state diagram below shows how we animate the heart pulse signal.
