_
Visual FFT
ECE5725 project
By Amy Wang (yw575) and Nick George (nkg37)
Demonstration Video
Introduction
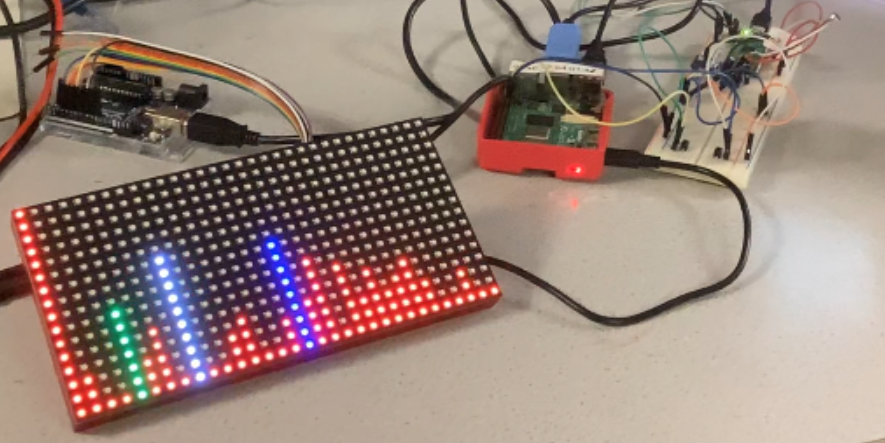
Our Visual FFT project involved performing a live FFT on music coming in from a small microphone. The project involved three parts: sampling, computation, and display. Data was sampled using an analog to digital converter (ADC), sent to our raspberry pi where we did FFT calculation into 32 frequency bins, and then forwarded it to an LED screen to be displayed within 32 bars with heights ranging from 15 to zero.
Project Objective:
- Listen to music coming in from a microphone
- Display a live FFT on a large LED array
- The system would be responsive enough to see the FFT work in real time as well as be able to display a wide range of frequencies
- Initially we intended for the range of frequencies to be along the full range of audible frequencies (60-20k)
Design
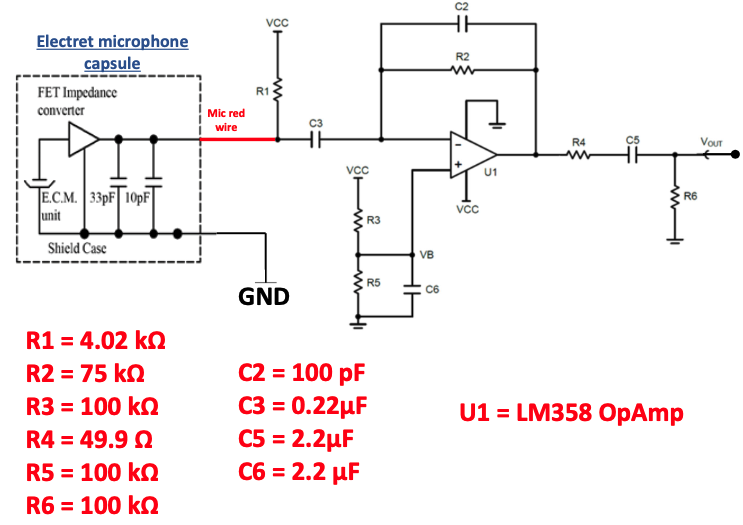
To start the project, one of the first things we did was get the microphone and sampling side of the project working as this was arguably the most important part of the project. We recognized that we needed to amplify the microphone circuit as well in order to optimize our audio input. Because we both took ECE 3400, we remembered using an amplified microphone circuit in that class. This circuit is incredibly useful as it also filters the input audio signal as well as amplifies it. With permission from Professor Skovira, we decided to use that amplification circuit. How the circuit was tested is described later in this section.
Another issue we encountered was that the raspberry pi did not have an ADC and only took in digital inputs (as it only had digital pins). Thus, some external system that could convert the analog sound signal into digital was necessary in order to do the sampling properly. Reviewing all of our options, we found that the easiest such ADC at our disposal was the internal ADC on the raspberry pi pico, as one of our group members (ADC) already had experience with using it.
We used Pico specific ADC code written by Professor Hunter Adams to sample the audio. We wrote the code to send the data from the Pico to the Pi ourselves. We had several options for how to send the code: SPI, I2C, and UART. We spent some time researching how to use the SPI to send the data because SPI is the fastest (and speed is important for our project because we want to display the FFT in real time). However, we settled for UART as we realized the difference in speed is minimal as we are only sending 64 samples at a time (we will explain why we are only collecting 64 samples later in this section). We also wanted to send the data in an array of 64 instead of one-by-one so that the pi can read the data and perform FFT computation faster. To do so we utilized the uart_puts() function to write a char array to the pi. Note that this function is blocking, meaning that the Pico will not continue the program until the entire array is sent. Because the audio samples taken into the Pico were integers, we had to convert each integer individually to a char array and then append all the char arrays together. Once the Pi received the data, we wrote code to convert the char array into an integer numpy array.

To test if the Pico was sending accurate data via UART transmission, we first tested by sending simple arrays such as [1, 2, 3, 4] and see if the Pi could print the incoming data correctly on the terminal. We then tested the microphone circuit and the UART transmission together by using Professor Hunter Adams code from lab1 of his class ECE4760. His code calculates FFT on the Pico and prints out the maximum frequency (Note that we did not calculate FFT on the Pico in our project). This code allowed us to see if our microphone was picking up the correct audio samples and if the data sent to the Pi was still correct. Again, we printed the input to the Pi on the terminal to compare to what we are sending. For example, if we played a pure tone of 440 near the microphone and the Pico was actively sending data to the Pi, then the Pi should display 440 on the terminal.
With the sample code we had, we were able to get a sample rate of about 10K Hz or samples per second. Due to the Nyquist rate, this means that the highest frequencies we would be able to accurately measure was 5khz. This was not nearly as high as we initially intended but it would suffice to get a baseline FFT working and if we really wanted to pursue it we could change some parameters to raise the sampling rate later.
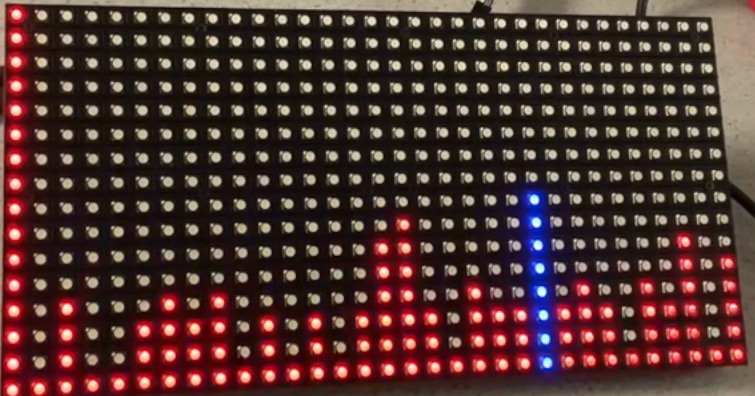
The next important part of the project would be to set up control of the LED display. For our LED display we used an Adafruit LED Matrix panel shown below.
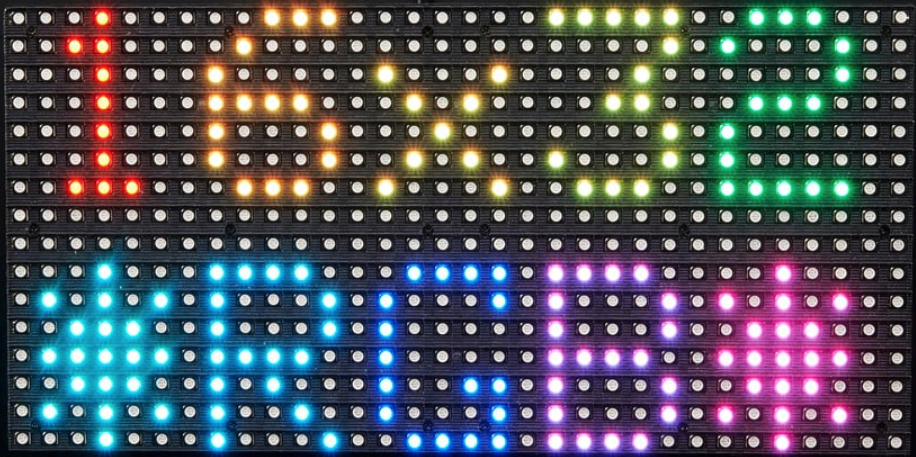
The first step was to get very basic control of the matrix to draw simple lines and change colors on the matrix. At first we tried looking up how to connect the matrix with the raspberry pi directly but after doing some research we discovered that it appeared to be fairly complicated and did not always work perfectly. Professor Skovira then informed us that a past group had used the LED display and instead used a separate arduino microcontroller in order to control the LED and control it by proxy through that. We decided to go with this method. We found a library pre-written and after some testing and tinkering we were able to get full control of the LED matrix as shown below.
Now we had achieved complete control of the led screen from the arduino side but now had to allow our raspberry pi control it through the arduino. The LED matrix has 32 rows. If we wanted to be able to control the height and color of each shown bar. This means that we would need to send 32*2 or 64 numbers. At first, we attempted to send all of this data over the serial port of the arduino to the raspberry pi using the UART protocol. The pi would send the height in one byte and the color in another. This did function and allowed us to control the colors, however the speed and responsiveness of the display was abysmal. If the sending from the raspberry pi was too fast (any faster than once a second) the screen would freeze up and stop moving. It became very clear that sending 64 bytes was not sustainable and the number of bytes had to be cut down somehow.
After some thought we thought one thing we could do to cut the number of bytes in half. The height value was from 0-15 which can be encoded in 4 bits since 24 equals 16. Colors could also be encoded in 4 bits if we limited ourselves to at most 16 colors. This means that in each byte we send, we could make the first 4 bits the color of the bar and the last 4 bits the height. On the pi side of the project, this was accomplished by taking the color value and left shifting it by 4 bits and doing a logical or in with the height data. Shifting is an extremely fast operation on a computer so this translation took very little time. With this optimization, we were able to cut down the number of data needed to be sent in half drastically increasing the responsiveness of the led screen. We were now able to send data every tenth of a second versus the 1 second limit before. This made the screen responsive enough to work for the project.

With the LED screen working and the data being sent over to the Pi, the last thing left was the actual FFT computation. In the interest of time and ensuring we could finish the project, we searched online in order to see if there were already written libraries for the FFT online. We found libraries made in the scipy and numpy libraries for python. We ran into issues when trying to install scipy as it was giving us dependency errors, we instead chose to use the numpy function and went with that.
The last component was to run the FFT calculations, put it into 32 bins and send it to the arduino to be placed on the screen. Due to our limited understanding of the DFT at the time, we made a few mistakes at the start when trying to do the computation. At first, we have the FFT 128 samples which returned an array with 128 values back, being the frequency bins. We wrongly assumed that from bins 0 to 127 represented the range of frequencies from 0 to 5000, and so in order to get 32 bins, we averaged every 128/32 or 4 bins together in order to get what we thought were 32 correct bins. When displaying this on the LED screen, this seemed to be responsive and definitely reacting to sounds, but the FFT was not quite correct. Its response to pure tones was clearly wrong and so we knew we had work to do.
We sat down and did a little more reading on the FFT in order to understand things a little better and came to the following understanding: when an FFT is calculated on a data set, the raw data comes in pairs of frequency where one frequency is positive and the other is negative, much like is shown in the image below.
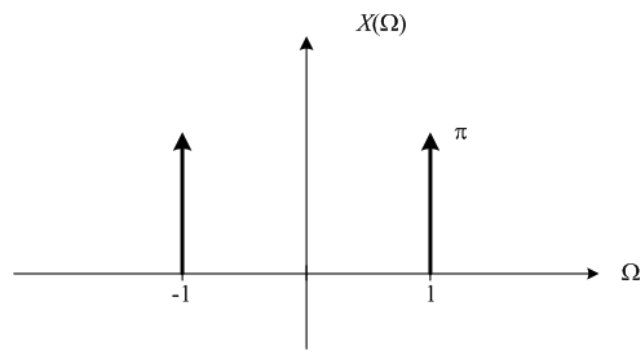
The negative term exists due to some exponential to describe sine waves. This means that half of the transform does not actually contain useful information and so to get the real frequencies we ignore the left side and multiply all of the right frequencies by two (also due to transform math). This means, in order to get 32 bins to display, we need 64 data points, run and FFT on them and use the 64/2 = 32 remaining actual data to display. With this new understanding, we changed the number of data points sent to 64. The width of a bin is our sample rate divided by the number of total bins (positive and negative) so in our case 10000/64 = 156.25 Hz per bin (and the first bin is called the zeroth bin). Additionally, we applied a simple filter via software to the FFT before it was sent to the LED screen in order to filter out noise. We simply zeroed any frequencies below 2dB in power.
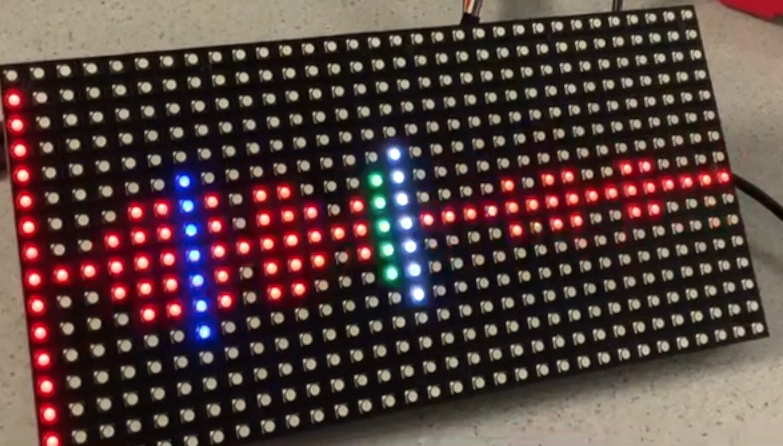
We also designed several different display modes that could be controlled by two buttons. This ensured that our system was still an embedded system and allowed for the user to mix and match the modes at will. These two buttons were connected to the Pi: button 1 was connected to GPIO 26 and button 2 was connected to GPIO 19. Button 1 controlled whether 1 or 3 maximums were displayed on the LED screen. With 1 maximum, the highest frequency would be white and the other bins were red; with 2 maximums, the highest frequency would be white, the second highest would be blue, the third highest would be green, and the other bins were red. Every time button 1 was pressed these two modes would toggle. Button 2 controlled whether the FFT bin grew from the bottom of the LED screen or from the middle. Every time button 2 was pressed these two modes would toggle.
Results
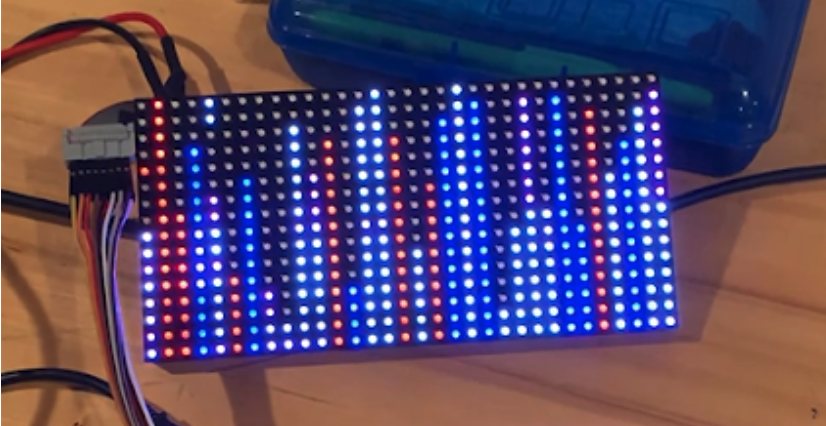
We were able to successfully apply FFT on music in real time and display it on the LED screen. The video below demonstrates this.
When the song has a lot of lower tones and you can see maximum frequency conjugating towards the lower bins. When the song adds higher notes and different tones, the 3 maximum frequencies are more spread out to cover more of what is happening in the song.
As seen in the demo video, the display responds well to the audio input as it shows the most recent frequency heard from the microphone. In the demo video, we used an app to play pure tones. As we increase the tones, the maximum frequency bar on the LED screen smoothly moves to the right towards the higher bins, indicating FFT is being done correctly.
Due to our sampling frequency (10K Hz), we were not able to capture the entire range of what humans can hear. Humans can hear up to 20k Hz and our LED screen only displays up to 5k Hz. However, this does not affect the accuracy of our project and in fact provides more granularity. If we were to capture the entire human hearing range, we would need a sampling rate of 40K Hz, but because the LED screen size is fixed the number of bins (32) is also fixed, resulting in the increase in bandwidth per bin. Each bin is now 625 Hz instead of 156.25 Hz.
Conclusion
Our embedded system included a Raspberry Pi 4, a Raspberry Pi Pico, an Arduino uno, an LED screen, and two external buttons. This embedded system was able to display a visual FFT on music in real-time. It was able to do so with a very visible responsiveness and could very easily be used as a low level frequency analyzer improvements could definitely be made in the future to make things smaller and more efficient but as a base concept the project did appear to work.
Future Work
If we had more time to work on the project, we would have sampled the entire human hearing range while also using a larger LED screen. By increasing the sampling rate to 40k Hz and using an LED screen with at least 128 columns we would have collected 256 samples (instead of 64), allowing for us to do FFT in real time on the entire hearing range without compromising on granularity.
We would have also used a better microphone and a better amplification plus filtering circuit. We would have spent more time coming up with the circuit ourselves so that we can tune it to fit our exact needs. Our current microphone circuit struggles to pick up on frequencies lower than 200Hz and when the sound is coming from a far. With a better microphone circuit, we would be able to take in audio inputs without the audio being right next to the microphone and be able to detect all frequencies easily.
We chose to use the numpy FFT function to save time, but with more time we would have written our own FFT algorithm. There are many efficient FFT algorithms more optimal than the numpy one, such as the Cooley-Tukey Algorithm.
Work Distribution
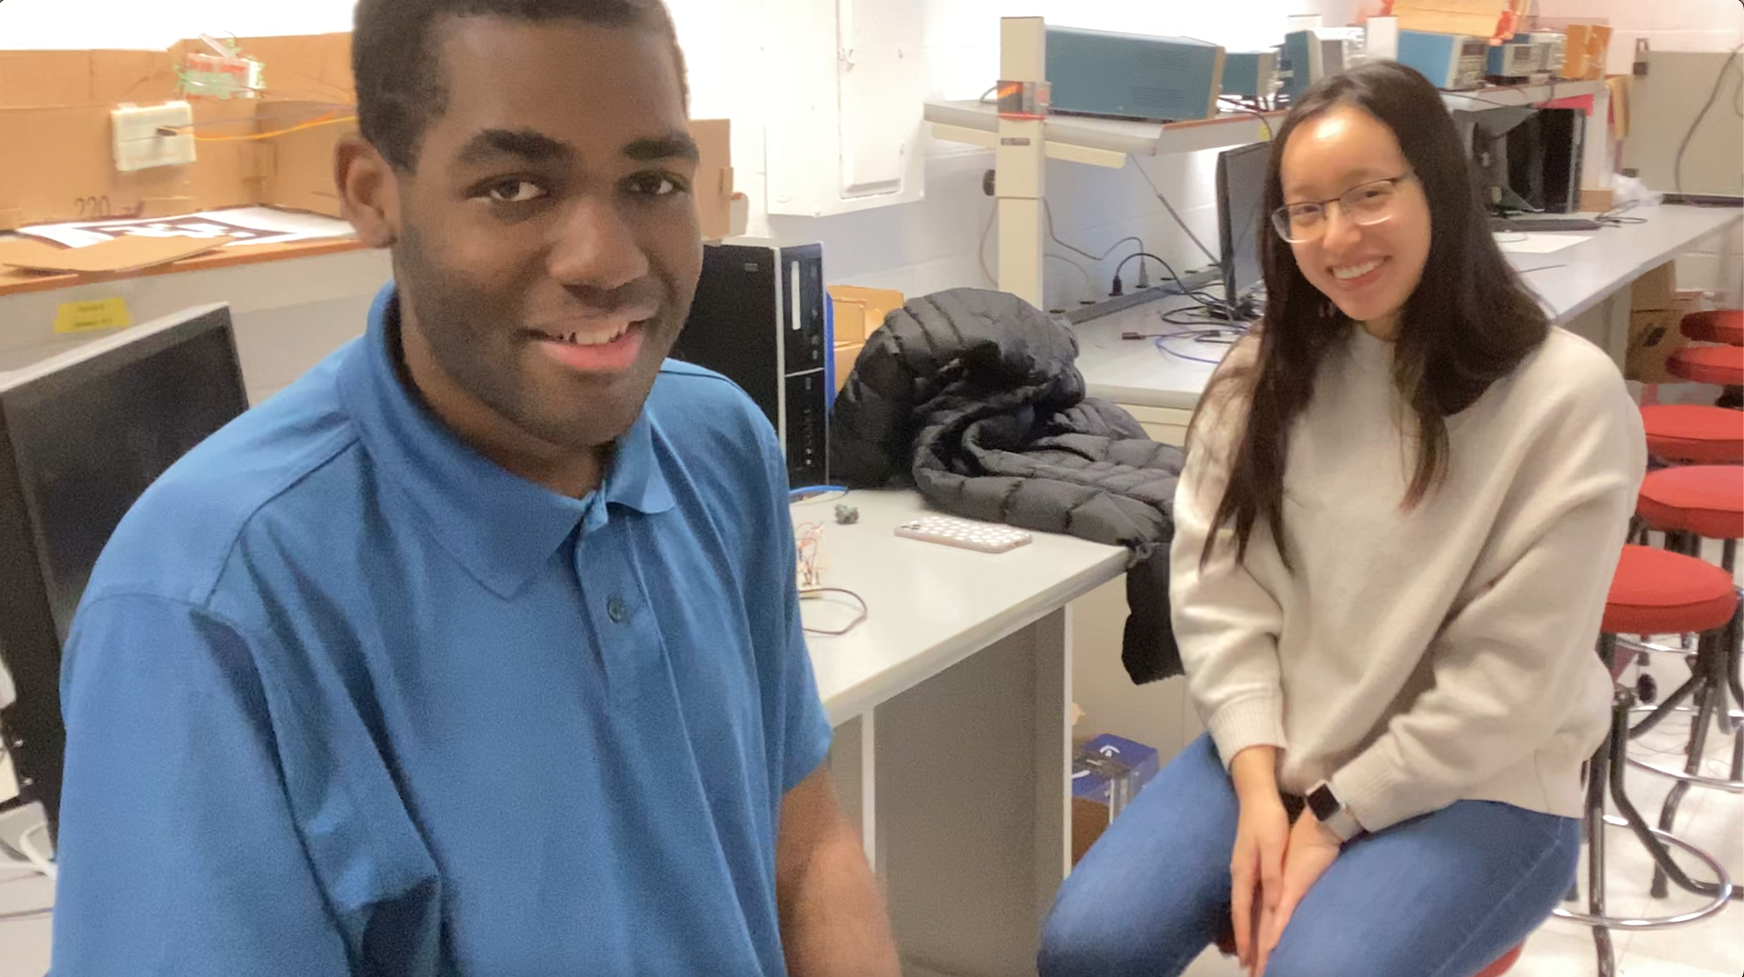
Project group picture
Nick
nkg37@cornell.edu
Programmed the Pi to send data to the Arduino
Programmed the Arduino to control the LED display
Worked with Amy to code and debug the Pi to do FFT calculations on the input audio and send the data to the LED screen
Helped Amy debug Pico code
Amy
yw575@cornell.edu
Worked on the micrphone and amplification circuit
Programmed the Pico to send audio sample to the Pi
Worked with Nick to code and debug the Pi to do FFT calculations on the input audio and send the data to the LED screen
Helped Nick debug Arduino code
Parts List
- Raspberry Pi 4 $35 - Provided in lab
- Raspberry Pi Pico $5 - Provided in lab
- Arduino Uno $24.25 - Provided in lab
- Medium 16x32 RGB LED matrix panel $24.95 - Provided in lab
- LM358 Op Amp - Already owned by Nick
- Capcitors, Resistors, Breadboard, Microphone, and Wires - Provided in lab
Total: $89.20
References
numpy FFTPico UART transmission
LED display with Arduino Uno
LED display datasheet
R-Pi GPIO Document
Pico datasheet
Arduino Uno datasheet
Lab handouts
Professor Hunter Adams ECE4760 Lab 1 Code
Code Appendix
Click for Code Repository
# By Amy Wang (yw575) and Nick George (nkg37)
# ECE 5725 Final Project: Visual FFT
# FFT_screen_class.py :calculates FFT and send the data to the Arduino Uno

import serial
from time import sleep
import numpy as np
from LED_control import LED
import RPi.GPIO as GPIO
from threading import Thread

#class to manage all of the project
class FFT_Screen(Thread):
    def __init__(self, middle=0):
        #run needed threading components
        super(FFT_Screen, self).__init__()
        #control whether middle mode on or not
        self.middle = middle
        #number of FFT points coming in
        self.FFT_size = 64
        #setting up the serial port to be used
        self.ser = serial.Serial('/dev/ttyUSB0', 115200);
        #make class to control the LED display
        self.screen = LED(bar_data_length=32, middle_mode=self.middle)
        #start sending data to the arduino
        self.screen.start()
        #to control the display mode
        self.display_mode = 0 #0 = 3 max mode 1 = 1 max mode
        #if true all diaplyed bars have the be greater than 2
        self.filtering = True
        #number of maximums to highlight
        self.num_maxes = 3
        #gpio related stuff
        GPIO.cleanup()
        GPIO.setmode(GPIO.BCM)
        GPIO.setup(26, GPIO.IN, pull_up_down=GPIO.PUD_UP)
        GPIO.setup(19, GPIO.IN, pull_up_down=GPIO.PUD_UP)

    def run(self):
        while True:
            #button Stuff
            if not GPIO.input(26):
                print("pressed")
                self.display_mode = 1-self.display_mode
                sleep(0.5)
            if not GPIO.input(19):
                self.screen.middle_mode = 1-self.screen.middle_mode
                sleep(0.5)
            #FFT stuff
            #decode the Data coming in from the Pico
            values = self.ser.readline().decode('ascii')
            #remove the first element from the data it does not contai anything
            values = values.split(",")[1:-1]
            #remove blanks form the data
            values = [int(i) for i in values if i != ""]
            #run the FFT
            yf = np.fft.fft(values)
            #only run if 64 data points sent
            N = len(values)
            if(N == self.FFT_size):
                #division by 2 due to FFT shift. Only use half of the values since only half are positive frequencies
                yff = (1.0/N * np.abs(yf[:N//2]))
                #filter off anything under 2 in height
                if self.filtering == True:
                    yff = np.array([i if i>2 else 0 for i in list(yff)])
                #Single maximum display mode
                if self.display_mode == 1:
                    #get the position of the highest value frequency
                    index = yff[1:].argmax()
                    #convert back to a list
                    yff = list(yff)
                    #make the maximum frequency bar blue, make the rest red
                    for i in range(self.FFT_size//2):
                        if i==index+1:
                            self.screen.column_color[i] = 2
                        else:
                            self.screen.column_color[i] = 0
                        self.screen.column_height[i] = int(yff[i])
                #3 Maximum mode where the highest 3 frequencies are highlighted
                elif self.display_mode == 0:
                    #make all of the bars red
                    for i in range(self.FFT_size//2):
                        self.screen.column_height[i] = int(yff[i])
                        self.screen.column_color[i] = 0
                    find_max = yff[1:]
                    #make the 3 highest red blue and green (high to low)
                    for i in range(self.num_maxes):
                        index = find_max.argmax()
                        self.screen.column_color[index+1] = i+1
                        find_max[index] = -1
                #quit if any other mode is given
                else:
                    quit()


if __name__ == "__main__":
    #run the project
    project = FFT_Screen()
    project.start()
# By Amy Wang (yw575) and Nick George (nkg37)
# ECE 5725 Final Project: Visual FFT
# LED_controls.py :controls how data is displayed on the LED screen

from threading import Thread
import serial
from time import sleep

"""
    This class exists to deal with all of the communicatiom between the PI and the Arduino to display
    each of the frequency bars. It is designed to run a thread to constantly send data to the raspberry pi
    while each bar and color can be controlled through different arrays
"""
class LED(Thread):
    def __init__(self, bar_data_length=15, middle_mode = 1):
        #run all things related the Threading parent class
        super(LED, self).__init__()
        #Number of data points sent
        self.bar_data_length=bar_data_length
        #array describing the bar Height
        self.column_height = [0]*self.bar_data_length
        #array describing the color of each bar. 0 = red, 1 = white, 2 = blue, 3 = green
        self.column_color = [0]*self.bar_data_length
        #used to turn on or off middle mode where the frequencies spread out from the center of the LED screen
        self.middle_mode = middle_mode
        #delay of sending the data
        self.sending_delay = 0.1
        #connect to serial port
        self.ser = serial.Serial('/dev/ttyACM0', 115200);

    #function to send the data to the arduino
    def send(self):
        #make the message packet. The first data point is whether to use middle mode or not
        message = [self.middle_mode]
        #Pack the message with the height and color of each column
        for i in range(self.bar_data_length):
            """
            The code here was used in order to shorten how many numbers we had to send. There are 32 bars with 32 different colors. Thats
            is 64 different numbers to send. In order to compress that into 32 number bit shifting was used. Each serial transimssion is
            1 byte or 8 bits. The first 4 bits are the color of the bar and the last 4 bytes are the height. Bit shifting was used to acomplish
            this
            """
            compressed = min(self.column_height[i],15)|(self.column_color[i]<<4)
            message.append(compressed)
        self.ser.write(message)

    #function which runs in the thread sending the data over and over again.
    def run(self):
        while True:
            self.send()
            sleep(self.sending_delay)
/**
 * ECE5725_PROJECT: VISUAL FFT by Amy Wang (yw575) and Nick George (nkg37)
 * adc.c
 *
 * Code took inspiration from:
 * Hunter Adams (vha3@cornell.edu)
 *
 * Core 0 collects audio samples and does ADC. Core 1 blinks the LED (to make sure the Pico is working).
 *
 * HARDWARE CONNECTIONS
 *  - GPIO 26 ---> Audio input [0-3.3V]
 *
 * RESOURCES USED
 *  - ADC channel 0
 *
 */

// Include standard libraries
#include <stdio.h>
#include <stdlib.h>
#include <string.h>
#include <math.h>
// Include Pico libraries
#include "pico/stdlib.h"
#include "pico/multicore.h"
// Include hardware libraries
#include "hardware/pio.h"
#include "hardware/dma.h"
#include "hardware/adc.h"
#include "hardware/irq.h"
// Include protothreads
#include "pt_cornell_rp2040_v1.h"

// Define the LED pin
#define LED     25

// === the fixed point macros (16.15) ========================================
typedef signed int fix15 ;
#define multfix15(a,b) ((fix15)((((signed long long)(a))*((signed long long)(b)))>>15))
#define float2fix15(a) ((fix15)((a)*32768.0)) // 2^15
#define fix2float15(a) ((float)(a)/32768.0)
#define absfix15(a) abs(a)
#define int2fix15(a) ((fix15)(a << 15))
#define fix2int15(a) ((int)(a >> 15))
#define char2fix15(a) (fix15)(((fix15)(a)) << 15)

/////////////////////////// ADC configuration ////////////////////////////////
// ADC Channel and pin
#define ADC_CHAN 0
#define ADC_PIN 26
// Number of samples
#define NUM_SAMPLES 64
// Sample rate (Hz)
#define Fs 10000.0
// ADC clock rate (unmutable!)
#define ADCCLK 48000000.0

// DMA channels for sampling ADC
int sample_chan = 2 ;
int control_chan = 3 ;

// Max and min macros
#define max(a,b) ((a>b)?a:b)
#define min(a,b) ((a<b)?a:b)

// Here's where we'll have the DMA channel put ADC samples
uint8_t sample_array[NUM_SAMPLES] ;

// int array for audio samples
int fr_int[NUM_SAMPLES] ;

//variables used to convert audio samples to a char array
char *str;
char *str2;
char *c;

// Pointer to address of start of sample buffer
uint8_t * sample_address_pointer = &sample_array[0] ;

// Runs on core 0
static PT_THREAD (protothread_fft(struct pt *pt))
{
    // Indicate beginning of thread
    PT_BEGIN(pt) ;
    // Start the ADC channel
    dma_start_channel_mask((1u << sample_chan)) ;
    // Start the ADC
    adc_run(true) ;

    //static variable: incrementing loop variable
    static int i ;


    char *str;
    str = "\n";
    //allocate memory for the char arrays
    char *str2 = malloc(64*NUM_SAMPLES*sizeof(char));
    char *c = malloc(4*sizeof(char));

    while(1) {
        // Wait for NUM_SAMPLES samples to be gathered
        // Measure wait time with timer. THIS IS BLOCKING
        dma_channel_wait_for_finish_blocking(sample_chan);

        //copy in audio samples
        for (i=0; i<NUM_SAMPLES; i++) {
            fr_int[i]=((int)sample_array[i]);
        }

        //initialize a 0 as the first char in the array
        str = "0,";
        //copy str to str2
        strcpy(str2, str);

        //convert the integer audio samples array into a char array
        for (int i=0; i<NUM_SAMPLES+1; i++) {
            c = malloc(4*sizeof(char));

            if(i == NUM_SAMPLES){
                sprintf(c, "\n", fr_int[i]);
            }else{
                sprintf(c, "%d,", fr_int[i]);
            }

            strcat(str2, c);
            free(c);
        }

        //write the char array to uart to be sent to the Pi THIS IS BLOCKING
        uart_puts(uart0, str2);

        // Restart the sample channel, now that we have our copy of the samples
        dma_channel_start(control_chan);
    }
    PT_END(pt) ;
}

static PT_THREAD (protothread_blink(struct pt *pt))
{
    // Indicate beginning of thread
    PT_BEGIN(pt) ;
    while (1) {
        // Toggle LED, then wait half a second
        gpio_put(LED, !gpio_get(LED)) ;
        PT_YIELD_usec(500000) ;
    }
    PT_END(pt) ;
}

// Core 1 entry point (main() for core 1)
void core1_entry() {
    // Add and schedule threads
    pt_add_thread(protothread_blink) ;
    pt_schedule_start ;
}

// Core 0 entry point
int main() {
    // Initialise UART 0
    uart_init(uart0, 115200);

    // Set the GPIO pin mux to the UART - 0 is TX, 1 is RX
    gpio_set_function(0, GPIO_FUNC_UART);
    gpio_set_function(1, GPIO_FUNC_UART);

    // Initialize stdio
    stdio_init_all();

    // Map LED to GPIO port, make it low
    gpio_init(LED) ;
    gpio_set_dir(LED, GPIO_OUT) ;
    gpio_put(LED, 0) ;

    ///////////////////////////////////////////////////////////////////////////////
    // ============================== ADC CONFIGURATION ==========================
    //////////////////////////////////////////////////////////////////////////////
    // Init GPIO for analogue use: hi-Z, no pulls, disable digital input buffer.
    adc_gpio_init(ADC_PIN);

    // Initialize the ADC harware
    // (resets it, enables the clock, spins until the hardware is ready)
    adc_init() ;

    // Select analog mux input (0...3 are GPIO 26, 27, 28, 29; 4 is temp sensor)
    adc_select_input(ADC_CHAN) ;

    // Setup the FIFO
    adc_fifo_setup(
        true,    // Write each completed conversion to the sample FIFO
        true,    // Enable DMA data request (DREQ)
        1,       // DREQ (and IRQ) asserted when at least 1 sample present
        false,   // We won't see the ERR bit because of 8 bit reads; disable.
        true     // Shift each sample to 8 bits when pushing to FIFO
    );

    // Divisor of 0 -> full speed. Free-running capture with the divider is
    // equivalent to pressing the ADC_CS_START_ONCE button once per `div + 1`
    // cycles (div not necessarily an integer). Each conversion takes 96
    // cycles, so in general you want a divider of 0 (hold down the button
    // continuously) or > 95 (take samples less frequently than 96 cycle
    // intervals). This is all timed by the 48 MHz ADC clock. This is setup
    // to grab a sample at 10kHz (48Mhz/10kHz - 1)
    adc_set_clkdiv(ADCCLK/Fs);

    /////////////////////////////////////////////////////////////////////////////////
    // ============================== ADC DMA CONFIGURATION =========================
    /////////////////////////////////////////////////////////////////////////////////

    // Channel configurations
    dma_channel_config c2 = dma_channel_get_default_config(sample_chan);
    dma_channel_config c3 = dma_channel_get_default_config(control_chan);


    // ADC SAMPLE CHANNEL
    // Reading from constant address, writing to incrementing byte addresses
    channel_config_set_transfer_data_size(&c2, DMA_SIZE_8);
    channel_config_set_read_increment(&c2, false);
    channel_config_set_write_increment(&c2, true);
    // Pace transfers based on availability of ADC samples
    channel_config_set_dreq(&c2, DREQ_ADC);
    // Configure the channel
    dma_channel_configure(sample_chan,
        &c2,            // channel config
        sample_array,   // dst
        &adc_hw->fifo,  // src
        NUM_SAMPLES,    // transfer count
        false            // don't start immediately
    );

    // CONTROL CHANNEL
    channel_config_set_transfer_data_size(&c3, DMA_SIZE_32);      // 32-bit txfers
    channel_config_set_read_increment(&c3, false);                // no read incrementing
    channel_config_set_write_increment(&c3, false);               // no write incrementing
    channel_config_set_chain_to(&c3, sample_chan);                // chain to sample chan

    dma_channel_configure(
        control_chan,                         // Channel to be configured
        &c3,                                // The configuration we just created
        &dma_hw->ch[sample_chan].write_addr,  // Write address (channel 0 read address)
        &sample_address_pointer,                   // Read address (POINTER TO AN ADDRESS)
        1,                                  // Number of transfers, in this case each is 4 byte
        false                               // Don't start immediately.
    );

    // Launch core 1
    multicore_launch_core1(core1_entry);

    pt_add_thread(protothread_fft) ;
    pt_schedule_start ;

}
// By Amy Wang (yw575) and Nick George (nkg37)
// ECE 5725 Final Project: Visual FFT
// raspi-led-control.ino: Arduino Uno controls LED screen

#include <RGBmatrixPanel.h>

#define CLK  8   // USE THIS ON ARDUINO UNO, ADAFRUIT METRO M0, etc.
//#define CLK A4 // USE THIS ON METRO M4 (not M0)
//#define CLK 11 // USE THIS ON ARDUINO MEGA
#define OE   9
#define LAT 10
#define A   A0
#define B   A1
#define C   A2

//parameters defining the data comming in
#define horizontal_length 32
#define num_bars 32
#define num_parameters 2
#define overhead_length 1 // one extra byte for whether to use middle mode or not

//class object to control the LED screen
RGBmatrixPanel matrix(A, B, C, CLK, LAT, OE, false);

//constants for the size of the whole message
#define size_message num_bars+overhead_length
#define data_size num_bars*num_parameters

//Variabe to store all of the bar data, color and height
uint16_t line[num_bars][num_parameters];

//Variables to control middle mode or not
int middle_mode = 1;
int middle_height = 0;

//buffer for data
byte buf[size_message];
int line_index = 0;

//common colors
uint16_t red;
uint16_t white;
uint16_t blue;
uint16_t green;
uint16_t color_list[4];

void setup() {
  //Setup the serial module
  Serial.begin(115200);
  matrix.begin();
  //get the values for all the colors
  red = matrix.Color333(1, 0, 0);
  white = matrix.Color333(1, 1, 1);
  blue = matrix.Color333(0, 0, 1);
  green =  matrix.Color333(0,1,0);

  //Initialize all of the bars
  color_list[0] = red;
  color_list[1] = white;
  color_list[2] = blue;
  color_list[3] = green;
}

void loop() {
  while(Serial.available()>0){
    //Read in the serial data
    Serial.readBytes(buf ,size_message);
    //capture the middle mode byte
    middle_mode = buf[0];
    //extract the column data for each frequency bin
    for(int index=0; index<num_bars; index+=1){
      line[index][0]= (int)(buf[index+1]&0b1111) >= 15 ? 15 : buf[index+1]&0b1111;
      int color = (buf[index+1]>>4);
      line[index][1]= color_list[color];
    }
  }

  matrix.fillScreen(matrix.Color333(0, 0, 0));
  //draw all of the lines
  for(int i=0; i<num_bars; i++){
    //put them starting from the center if its in middle mode
    if(!middle_mode){
      matrix.drawLine(horizontal_length-1-i, 0, horizontal_length-1-i, line[i][0], line[i][1]);
    }
    //run in normal mode
    else{
      middle_height = line[i][0]/2;
      matrix.drawLine(horizontal_length-1-i, (7-middle_height), horizontal_length-1-i, (7+middle_height), line[i][1]);
    }
  }
  //do some delaay before reading serial data again
  delay(20);
}