Reptile monitoring system
Jingyi Wang(jw979), Nuo Tan (nt263)
2021.12.09
Demonstration Video
Project Objective
Reptiles are a niche pet choice but are gaining increasing popularity. They have little requirements for living space, but extremely high requirements for the temperature and humidity in the environment, and can only survive in a limited range of temperature and humidity. Since reptiles cannot express discomfort and abnormality in time like mammals such as cats or dogs, and also because the bleeders could not monitor the pets’ condition all the time, breeders must invest a lot of energy and time when raising reptiles. In order to facilitate the breeders, we have developed a system to monitor the living environment and activity state of the reptiles and send SMS to remind the breeders when the system detects an abnormality.
Introduction
For our project, we have developed a reptile breeding system that can automatically monitor and send alarm. The system used DHT11 sensors to detect the temperature and humidity of the reptile's living environment. When the temperature and humidity are not within the appropriate range, it will automatically send a warning text message to the breeder's mobile phone. The system used a camera and OpenCV to monitor the motions of reptiles. When the motions of reptiles are too frequent, the camera will take a latest photo and upload it to the webpage connected to the system for the breeders to view. The temperature, humidity and the number of motions will be stored in a database and displayed as a line graph on the web page. We have created a web page for breeders to view real-time temperature and humidity, historical data line graphs of temperature, humidity and motions and latest photo. The time range of historical data can be arbitrarily selected.
Design and Testing
System Design OverviewFigure 1 shows the system design workflow diagram. Figure 2 and Figure 3 show the photos of the system.
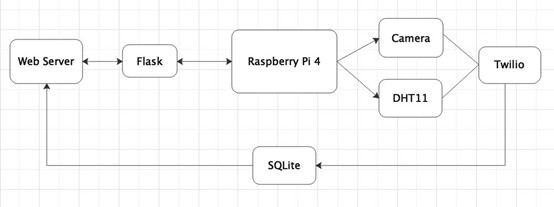
Figure 1: System Design Workflow
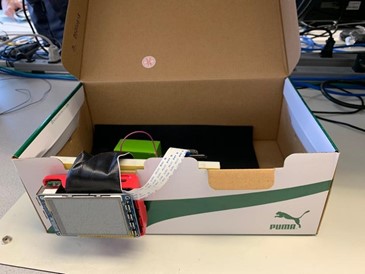
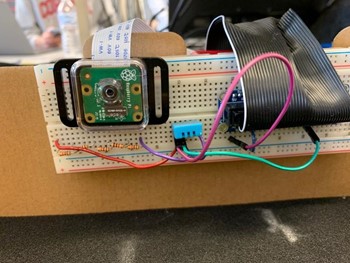
Figure 2: Photo of system
Humidity, Temperature Detection and Warning
The sensor used to monitor the temperature and humidity of the environment is DHT11. The circuit connection schematic of the DHT11 sensor is shown in Figure 3.
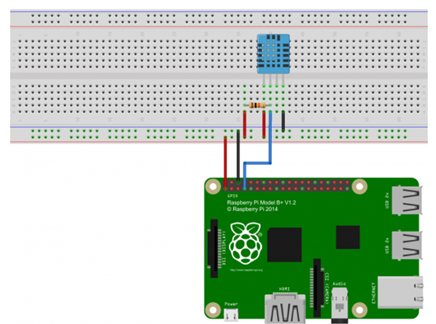
Figure 3: DHT11 sensor schematic
The DHT11 is a basic, ultra low-cost digital temperature and humidity sensor.[1] It uses a capacitive humidity sensor and a thermistor to measure the surrounding air and spits out a digital signal on the GPIO pin. It's fairly simple to use but requires careful timing to grab data. To use the DHT11 on raspberry Pi, the CircuitPython-DHT library needed to be installed to communicate with the DHT sensor. The library called adafruit_blinka was used to provide the layer that translates the CircuitPython hardware API to whatever library the Linux board provides.[2] The DHT sensor was set to read the environment temperature and humidity periodically. The temperature captured is in degrees Celsius, the humidity captured is in percentage. The logDHT.py program also has a warning function, when the system detects an unsuitable temperature or humidity for the reptile,the program will send a text message to the user. Program logDHT.py was written to accomplish this, the running result of which is shown in Figure 4. For demonstration, the data fetching period was set to be one minute, in real practice this period should be longer or editable by the user, and the warning threshold as temperature exceeds 25 degrees or humidity below 5%, which should be a more specific value regarding the type of the reptile.
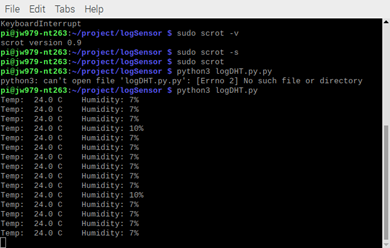
Figure 4: Running result of program logDHT.py
When running this program, the error “Unsigned short is greater than maximum” appeared occasionally. Little reference could be found online to stress this problem; we found out this error is related to the loose wire connection by printing out the state when the captured data is none.
Motion Detection and Warning
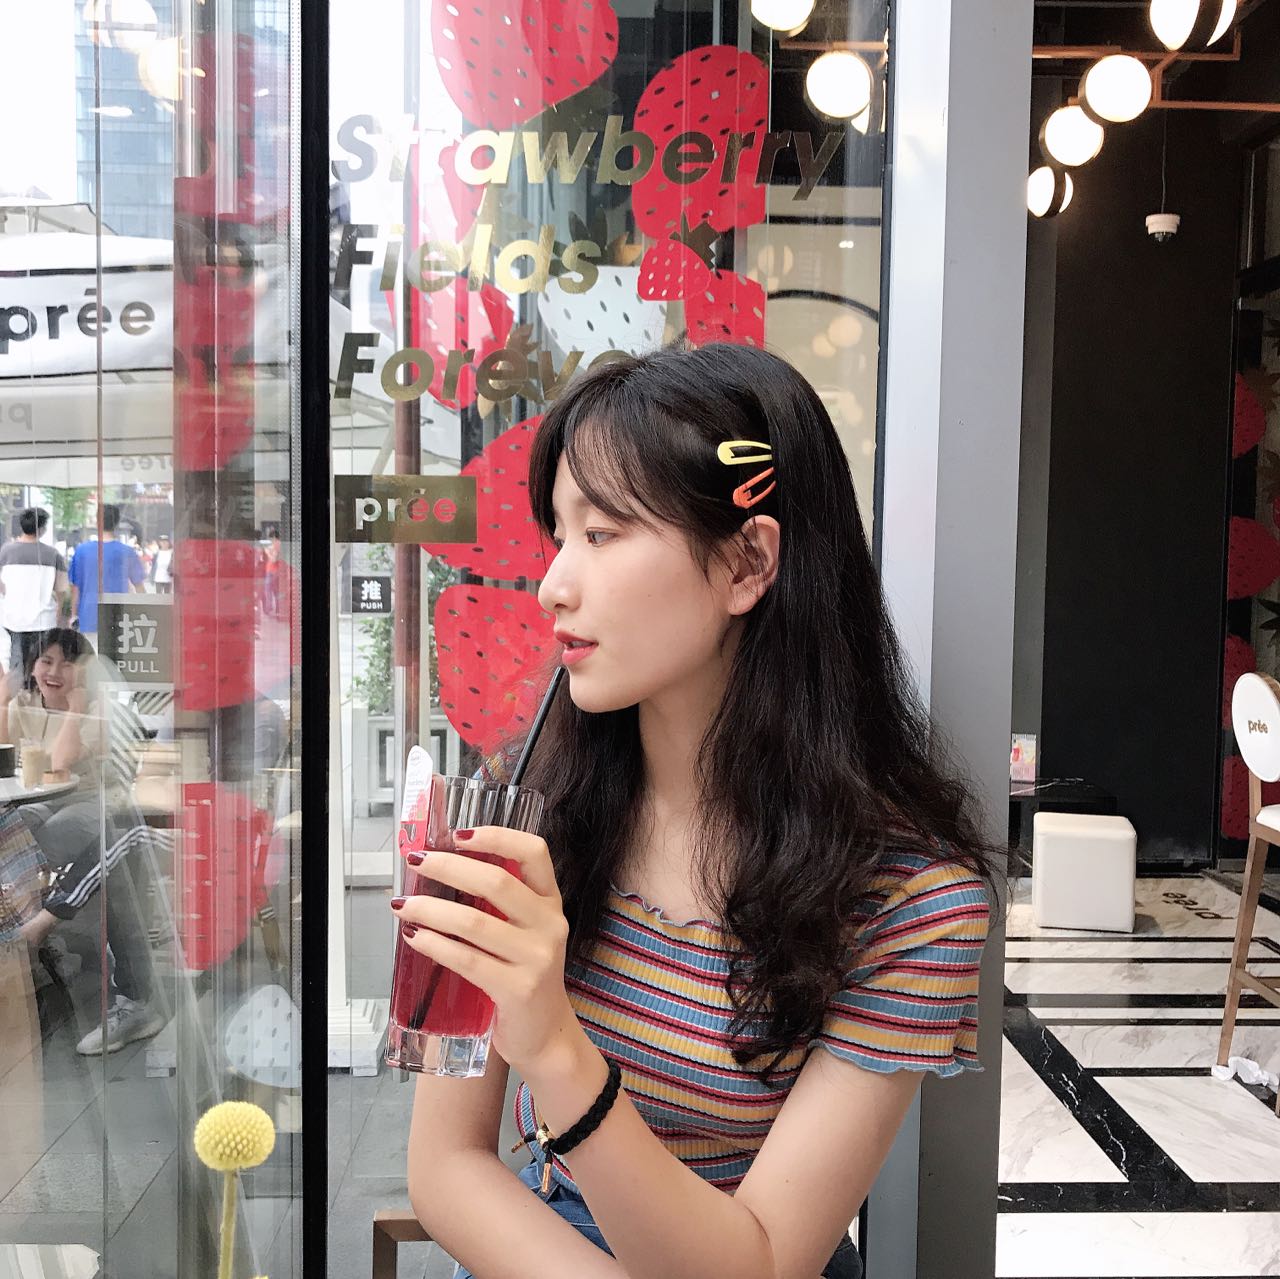
The motion detection was accomplished by using a Pi camera and OpenCV. The camera constantly captures grayscale images, applies a stronger level of Gaussian blurring and compares their differences in pixels. When the pixel difference is above an experimental threshold, it is determined that the reptile has made a movement. The program is set to record the number of movements over a period of time and store the motion data in the database. The program logCAM.py was used to accomplish this, the running result of which is shown in Figure 5. Here for demonstration, the period was set to ten seconds, in reality it should be longer, or editable by users. The logCam.py program also has the warning function, when the number of motion over a period is greater than a threshold, which is abnormal for the reptiles which are usually not pretty active, the program will send text message to the user, the camera will automatically take a picture and upload the photo to the web page for the breeder to check the state of the reptile. For demonstration, this threshold was set to 10 times within 10 seconds. As shown in Figure 5, the third line shown in console is the messaging service sid of the text message sent for the 11 motion detected over 10 seconds.
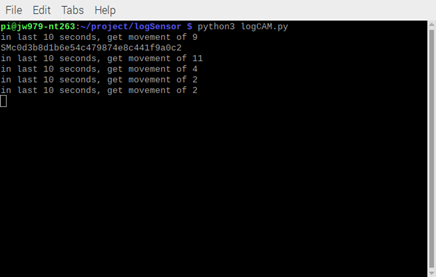
Figure 5: Running result of the program logCAM.py
Issue encountered on installing the opencv library. Initially we used the command sudo “apt-get install libopencv-dev python-opencv” and was able to import cv2 in Python. However, after some time we found that the cv2 could not be imported again in either Python2 or Python3 though reinstallation would yield the result “opencv has already been installed”. We settle the problem by using the last block of commands in the note updated on 4/19/2020 on Canvas module “OpenCV Install; Install of pre-compiled Library - Fast!”, with a flag and os version(“-t buster”) at the end.
Data storage
SQLite3 is used to create a database to store temperature, humidity data, number of movement, and the time of when the data was captured. Initially we kept meeting the problem of “unmet dependencies” when installing the sqlite3 with the statement "sudo apt-get install SQLite3". Then we added the flag with the linux os version at the end of this command, using "sudo apt-get install SQLite3 -t buster" to solve this problem.
The data of time, temperature, humidity and movement are all stored in one database. n two separate tables.Figure 6 shows the two tables and 5 latest data from each table in this database.
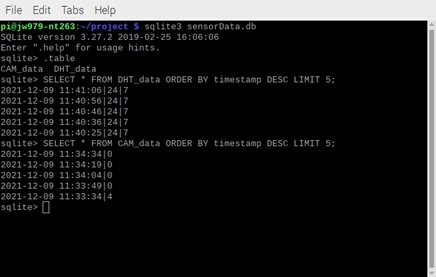
Figure 6: Database display
Text Sending
We registered an account in Twilio and used the Python code to send text messages. Our text system would send two types of text, to warn the user of the unsuitable environment or abnormal pet behavior respectively. Figure 7 shows the SMS message the users would receive.
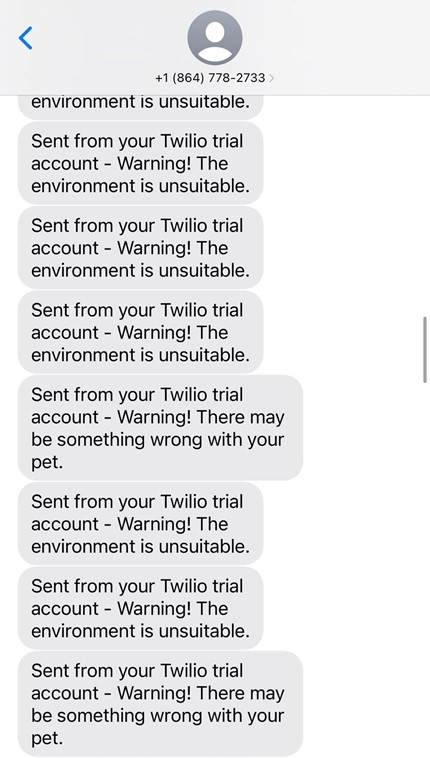
Figure 7: Text warning sent by the system
Web Server
Flask was installed. Then we used Flask to create a python WebServer.[5] The index.html and style.css files are used to build the front-end, and the appWeb.py file is used to retrieve data from the database and return it to the web page. This web page can be accessed from multiple smart devices such as mobile phones and computers. Figure 8 shows a complete view of our web page. We use JustGage to display the current temperature and humidity in the form of meters on the website. The web page also contains the function of querying historical data. Breeders can enter the range of historical data they want to query. We used Matplotlib to display the historical data in the form of a line graph on the web page. The last part of the web page is a real-time photo. Our original design was to put a video stream on the web page so that the breeders could watch the reptile state in real time. However, due to the huge thread and memory usage of the video stream, it would become very lagging one the web page. We gave up on this design and decided to take pictures. Each time, the new photo will overwrite the original photo and be displayed on the web page.
We occasionally encountered the problem of not properly loaded pictures, which is due to the error “ProgrammingError: Recursive use of cursors not allowed”. That was because the sqlite3 module doesn't like multithread cases, a threading lock for retrieving data from database each time could settle this problem.
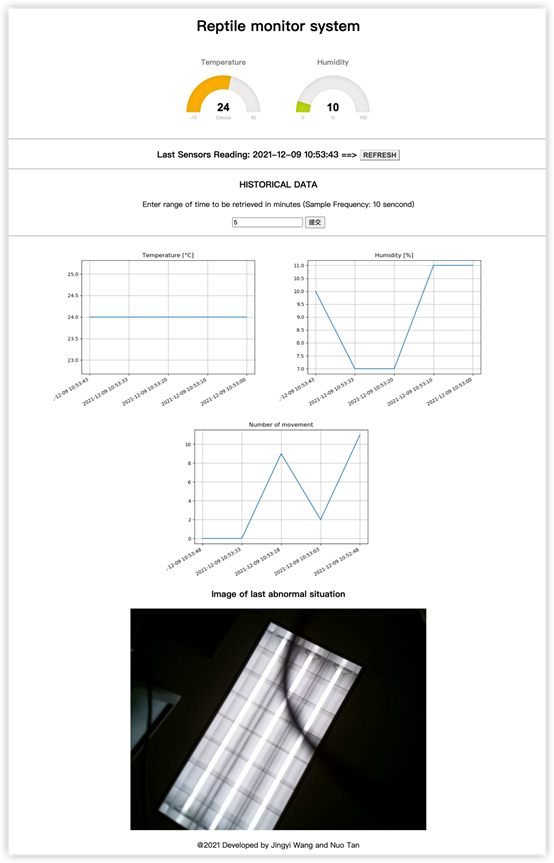
Figure 8: Complete view of web page
Results and Conclusion
Our team achieved all the goals listed in the initial description. Just replaced the email reminder with a more convenient SMS reminder. Also added a real-time camera function. Everything performed as planned. Our project can automatically monitor the temperature and humidity of the environment and send alert messages to the breeders when data are not in the suitable range. Breeders can view real-time environmental temperature and humidity and query historical data of temperature, humidity and reptile movements through the web page. Breeders can also see real-time photos of reptile on the web. What we found definitely did not work is that SQLite3 cannot accept multi-threaded tasks. When we try to draw a line chart on the web page in multiple threads, the image will not be loaded.
Future Work
If we have more time to work on this project, we hope to design the web page as a mobile application. Each breeder can register his own account on the application and customize the breeding environment conditions of multiple different reptiles. Realize the video streaming function so that the breeder can check the current state of the reptiles with the mobile phone at any time. If possible, we also hope to add automatic feeding and clean functions to completely make the breeders free.
Parts & Budget
| Parts | Quantity | Cost(USD) |
|---|---|---|
| Raspberry Pi | 1 | 35 |
| DHT11 Sensor | 2 | 10 |
| Raspberry Pi Camera | 1 | 29.95 |
Reference
DHT11, DHT22 and AM2302 SensorsDHT Humidity Sensing on Raspberry Pi or Beaglebone Black with GDocs Logging
Camera and OpenCV installation
Movement Detection
Send Text message
Build a Python Web Server with Flask
ProgrammingError: Recursive use of cursors not allowed
Past project: Plant Care
Work Distribution

Nuo Tan
nt263@cornell.edu
Motion detection, real-time take photographs, sending warning SMS, debug, web development, hardware assembly
Jingyi Wang
jw979@cornell.edu
Circuit connection, database creation, temperature and humidity detection, web development, hardware assembly
Code Appendix
Please refer to our Github for all the files, here we just demonstrate the most important pieces.
appWeb.py#!/usr/bin/env python ''' RPi WEb Server for DHT and motion captured data with Gage and Graph plot ''' import cv2 from flask import Flask, render_template, Response from datetime import datetime from matplotlib.backends.backend_agg import FigureCanvasAgg as FigureCanvas from matplotlib.figure import Figure import io import os from flask import Flask, render_template, send_file, make_response, request app = Flask(__name__) import threading #from threading import Thread import sqlite3 conn=sqlite3.connect('../sensorData.db', check_same_thread=False) curs=conn.cursor() #os.system('python ../logSensor/logDHT.py') #os.system('python ../logSensor/logCAM.py') # Define the lock globally lock = threading.Lock() def stream(camera_index): cam = cv2.VideoCapture(camera_index) while True: _, frame = cam.read() ret, jpg = cv2.imencode('.jpg', frame) jpg2bytes = jpg.tobytes() yield b'--frame\r\nContent-Type: image/jpeg\r\n\r\n' + jpg2bytes + b'\r\n\r\n' # Retrieve LAST data from database def getLastData(): try: lock.acquire(True) for row in curs.execute("SELECT * FROM DHT_data ORDER BY timestamp DESC LIMIT 1"): time1 = str(row[0]) temp = row[1] hum = row[2] finally: lock.release() return time1, temp, hum # Get 'x' samples of historical data def getHistData (numSamples): dates1 = [] temps = [] hums = [] dates2 = [] move = [] #for row in reversed(data1): try: lock.acquire(True) for row in curs.execute("SELECT * FROM DHT_data ORDER BY timestamp DESC LIMIT "+str(numSamples)): dates1.append(row[0]) temps.append(row[1]) hums.append(row[2]) #temps, hums = testeData(temps, hums) #for row in reversed(data2): for row in curs.execute("SELECT * FROM CAM_data ORDER BY timestamp DESC LIMIT "+str(numSamples)): dates2.append(row[0]) move.append(row[1]) finally: lock.release() return dates1, temps, hums, dates2, move # Test data for cleanning possible "out of range" values def testeData(temps, hums): n = len(temps) for i in range(0, n-1): if (temps[i] < -10 or temps[i] >50): temps[i] = temps[i-2] if (hums[i] < 0 or hums[i] >100): hums[i] = temps[i-2] return temps, hums # Get Max number of rows (table size) def maxRowsTable(): for row in curs.execute("select COUNT(temp) from DHT_data"): maxNumberRows=row[0] return maxNumberRows # Get Max number of rows (table size) def maxRowsTable1(): for row in curs.execute("select COUNT(move) from CAM_data"): maxNumberRows=row[0] return maxNumberRows # Get sample frequency in minutes def freqSample(): freq=1 return (freq) # define and initialize global variables global numSamples numSamples = maxRowsTable() global numSamples1 numSamples1 = maxRowsTable1() if (numSamples >6): numSamples = 5 if (numSamples1 > 6): numSamples1 = 5 global freqSamples freqSamples = freqSample() global rangeTime rangeTime = 5 # main route @app.route("/") def index(): time1, temp, hum = getLastData() templateData = { 'time1' : time1, 'temp' : temp, 'hum' : hum, 'freq' : freqSamples, 'rangeTime' : rangeTime } return render_template('index.html', **templateData) @app.route('/', methods=['POST']) def my_form_post(): global numSamples global freqSamples global rangeTime rangeTime = int (request.form['rangeTime']) if (rangeTime < freqSamples): rangeTime = freqSamples + 1 numSamples = rangeTime//freqSamples numMaxSamples = maxRowsTable() if (numSamples > numMaxSamples): numSamples = (numMaxSamples-1) time1, temp, hum = getLastData() templateData = { 'time1' : time1, 'temp' : temp, 'hum' : hum, 'freq' : freqSamples, 'rangeTime' : rangeTime } return render_template('index.html', **templateData) @app.route('/plot/temp') def plot_temp(): times1, temps, hums, times2, move = getHistData(numSamples) ys = temps fig = Figure() axis = fig.add_subplot(1, 1, 1) axis.set_title("Temperature [°C]") #axis.set_xlabel("Samples") fig.autofmt_xdate() axis.grid(True) xs = times1 #xs = range(numSamples) axis.plot(xs, ys) canvas = FigureCanvas(fig) output = io.BytesIO() canvas.print_png(output) response = make_response(output.getvalue()) response.mimetype = 'image/png' return response @app.route('/plot/hum') def plot_hum(): times1, temps, hums, times2, move = getHistData(numSamples) ys = hums fig = Figure() axis = fig.add_subplot(1, 1, 1) axis.set_title("Humidity [%]") #axis.set_xlabel("Samples") fig.autofmt_xdate() axis.grid(True) xs = times1 #xs = range(numSamples) axis.plot(xs, ys) canvas = FigureCanvas(fig) output = io.BytesIO() canvas.print_png(output) response = make_response(output.getvalue()) response.mimetype = 'image/png' return response @app.route('/plot/move') def plot_move(): times1, temps, hums, times2, move = getHistData(numSamples) ys = move fig = Figure() axis = fig.add_subplot(1,1,1) axis.set_title("Number of movement") fig.autofmt_xdate() #axis.set_xlabel("Data get from ") axis.grid(True) #xs = range(numSamples) xs = times2 axis.plot(xs, ys) #axis.invert_xaxis() canvas = FigureCanvas(fig) output = io.BytesIO() canvas.print_png(output) response = make_response(output.getvalue()) response.mimetype = 'image/png' return response @app.route('/stream_feed') def stream_feed(): return Response(stream(0), mimetype='multipart/x-mixed-replace; boundary=frame') if __name__ == "__main__": app.run(host='0.0.0.0', port=8000, debug=False)
logCAM.py
import time
import sqlite3
import cv2
import os
#give the system sometime to warm up
time.sleep(0.2)
# Read the video file / source
cap = cv2.VideoCapture(0)

dbname='../sensorData.db'


# Set the counter
#counter=0

sampleFreq = 5 # time in seconds

# get data from pi cam
def getCAMdata():
  starttime=time.time()
  counter =0
  while (time.time()-starttime<10):
    # Capture the 1st & 2nd frames and store them in resp. variables:
    global ret1
    global frame1

    ret1, frame1 = cap.read()
    time.sleep(0.4)
    global rect2
    global frame2
    ret2, frame2 = cap.read()

    # Convert the frame1 & frame2 into gray scale to calculate differences:
    frame1_gray = cv2.cvtColor(frame1, cv2.COLOR_BGR2GRAY)
    frame2_gray = cv2.cvtColor(frame2, cv2.COLOR_BGR2GRAY)
    # Apply the Gaussian blur onto the gray scale frames
    # Kernel size is 21*21 which applies a stronger level of blurring:
    frame1_blur = cv2.GaussianBlur(frame1_gray, (21, 21), 0)
    frame2_blur = cv2.GaussianBlur(frame2_gray, (21, 21), 0)

    # Calculate the difference between the two frames:
    frames_diff = cv2.absdiff(frame1_blur, frame2_blur)

    # Background in black and motion in white
    threshold = cv2.threshold(frames_diff, 25, 255, cv2.THRESH_BINARY)[1]
    threshold = cv2.dilate(threshold,None)
    # Calculate the average of the frame:
    average_diff = threshold.mean()

    if average_diff:
      counter+=1

    # Repeat the same for the upcoming frames in the video:
    frame1 = frame2
    time.sleep(0.4)
    ret, frame2 = cap.read()
    ''' ret:
     break
   k = cv2.waitKey(10)
   if k == ord('q'):
     break'''
  if counter > 10:
    os.system('python ./textMessage/camText.py')
    #cap1=cv2.VideoCapture(0)
    #reci,img = cap1.read()
    cv2.imwrite("../webServer/static/photo/output.jpg", frame2)

  return counter

# log sensor data on database
def logData (move):

  conn=sqlite3.connect(dbname)
  curs=conn.cursor()

  curs.execute("INSERT INTO CAM_data VALUES(datetime('now','localtime'), (?))", (move,))
  conn.commit()
  conn.close()

# main function
def main():
  while True:
    #move=0
    move = getCAMdata()
    print("in last 10 seconds, get movement of "+ str(move))
    logData (move)
    time.sleep(sampleFreq)

# ------------ Execute program
main()


cv2.destroyAllWindows()
logDHT.py
#!/usr/bin/env python
#  Capture data from a DHT11 sensor and save it on a database

import time
import sqlite3
import board
import adafruit_dht
import RPi.GPIO as GPIO
import os

dbname='../sensorData.db'
sampleFreq = 10 # time in seconds
dhtDevice = adafruit_dht.DHT11(board.D6)

# get data from DHT sensor
def getDHTdata():

  # Print the values to the serial port
  temp=None
  hum =None

  try:
    temp = dhtDevice.temperature
    hum = dhtDevice.humidity
    if hum is not None and temp is not None:
      hum = round(hum)
      temp = round(temp, 1)

    print(
    "Temp:  {:.1f} C    Humidity: {}% ".format(
    temp, hum
    )
    )

    if temp>25 or hum<5:
      os.system('python /home/pi/project/logSensor/textMessage/sensorText.py')


  except RuntimeError as error:
    # Errors happen fairly often, DHT's are hard to read, just keep going
    time.sleep(2.0)
  except Exception as error:
    dhtDevice.exit()
    raise error
  except OverflowError as error:
    print("meet error"+ str(error))

  return temp, hum

# log sensor data on database
def logData (temp, hum):
  conn=sqlite3.connect(dbname)
  curs=conn.cursor()

  curs.execute("INSERT INTO DHT_data values(datetime('now','localtime'), (?), (?))", (temp, hum))
  conn.commit()
  conn.close()

# main function
def main():
  while True:
    temp, hum = getDHTdata()
    if temp is None or hum is None:
      #print("The DHT failed to work!!!!!!!!!")
      continue
    logData (temp, hum)
    time.sleep(sampleFreq)

# ------------ Execute program
main()

GPIO.cleanup()