Hydroponics Monitoring System
ECE 5725, Fall 2020
December 18th, 2020
Anthony Viego (amv64) & Cameron Haire (cdh99)
Introduction
The Hydroponics Monitoring System (HMS) is an embedded system designed to assist in the monitoring of plant growth. The system uses a Raspberry Pi at its core, and features a controllable pump, pH sensor, and ppm sensor which allow for the user to easily understand the state of the hydroponics enclosure. The system also features a website which contains information such as the data collected from these sensors along with pictures taken of each plant over time.
Project Objective:
Our objective for this project was to create a system capable of allowing for plant growth while also being able to monitor plant growth as well as the state of the hydroponics enclosure. As it would not be ideal to have to babysit the plants, we created a website which allows for the remote monitoring of the system.
Design & Testing
Hydroponics Structure Design and Testing
The hydroponics bay design itself was probably one of the more challenging aspects of this project. As one of our main goals with this system was to create a real working hydroponics setup capable of
allowing for plant growth, we also wanted to ensure that we could grow a decent number of plants at a time. As such, our first step in this project was to create a design for the physical
structure itself. Originally we were hoping to be able to support 10-12 plants, but due to budget constraints we
had to scale this back to around 8 plants. To support 8 plants in our system, we chose to proceed with a tiered approach to designing the physical structure. The idea is that using a tiered system, we could
easily fit more plants into the small amount of space that exists on the window sill of Cameron's apartment. As we wanted to create a tiered system, we chose to take the approach of using square PVC fence
posts rather than the traditional circular PVC. The idea was that the square fence posts would be easier to support in a low-budget tiered system, and we could use the square PVC itself to form a support
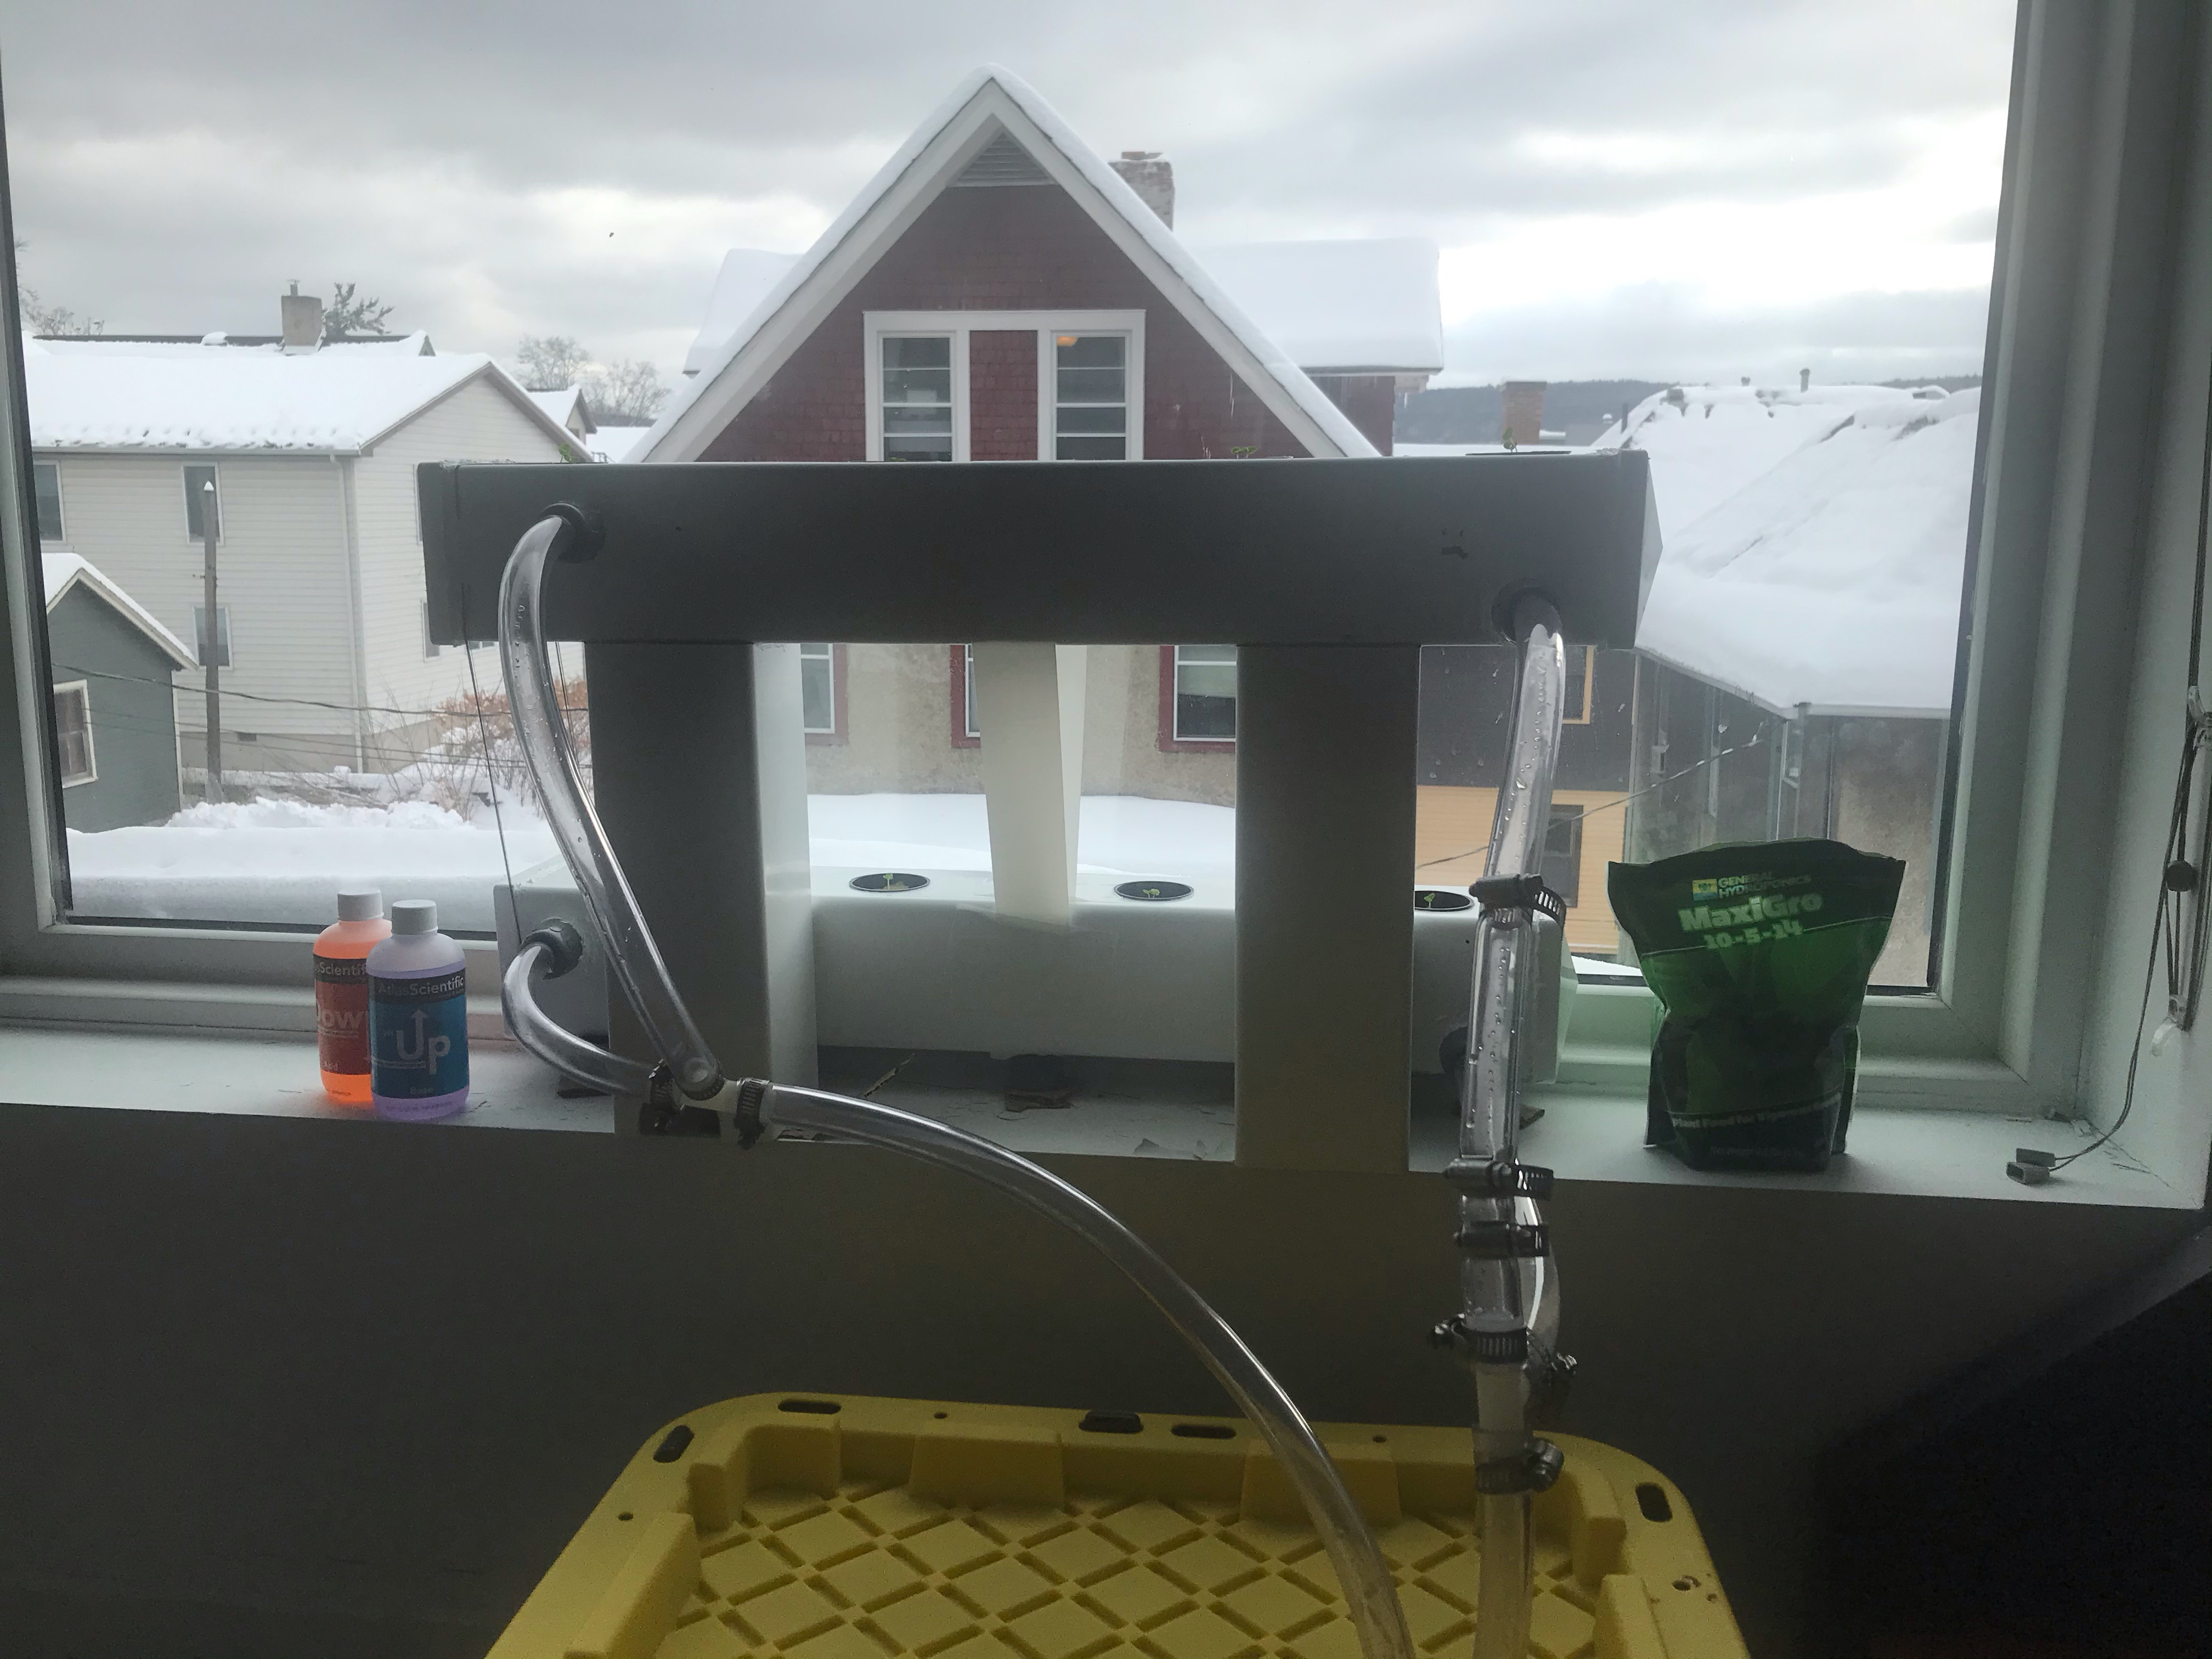
mechanism. The initial design of this system can be seen in figure 1.
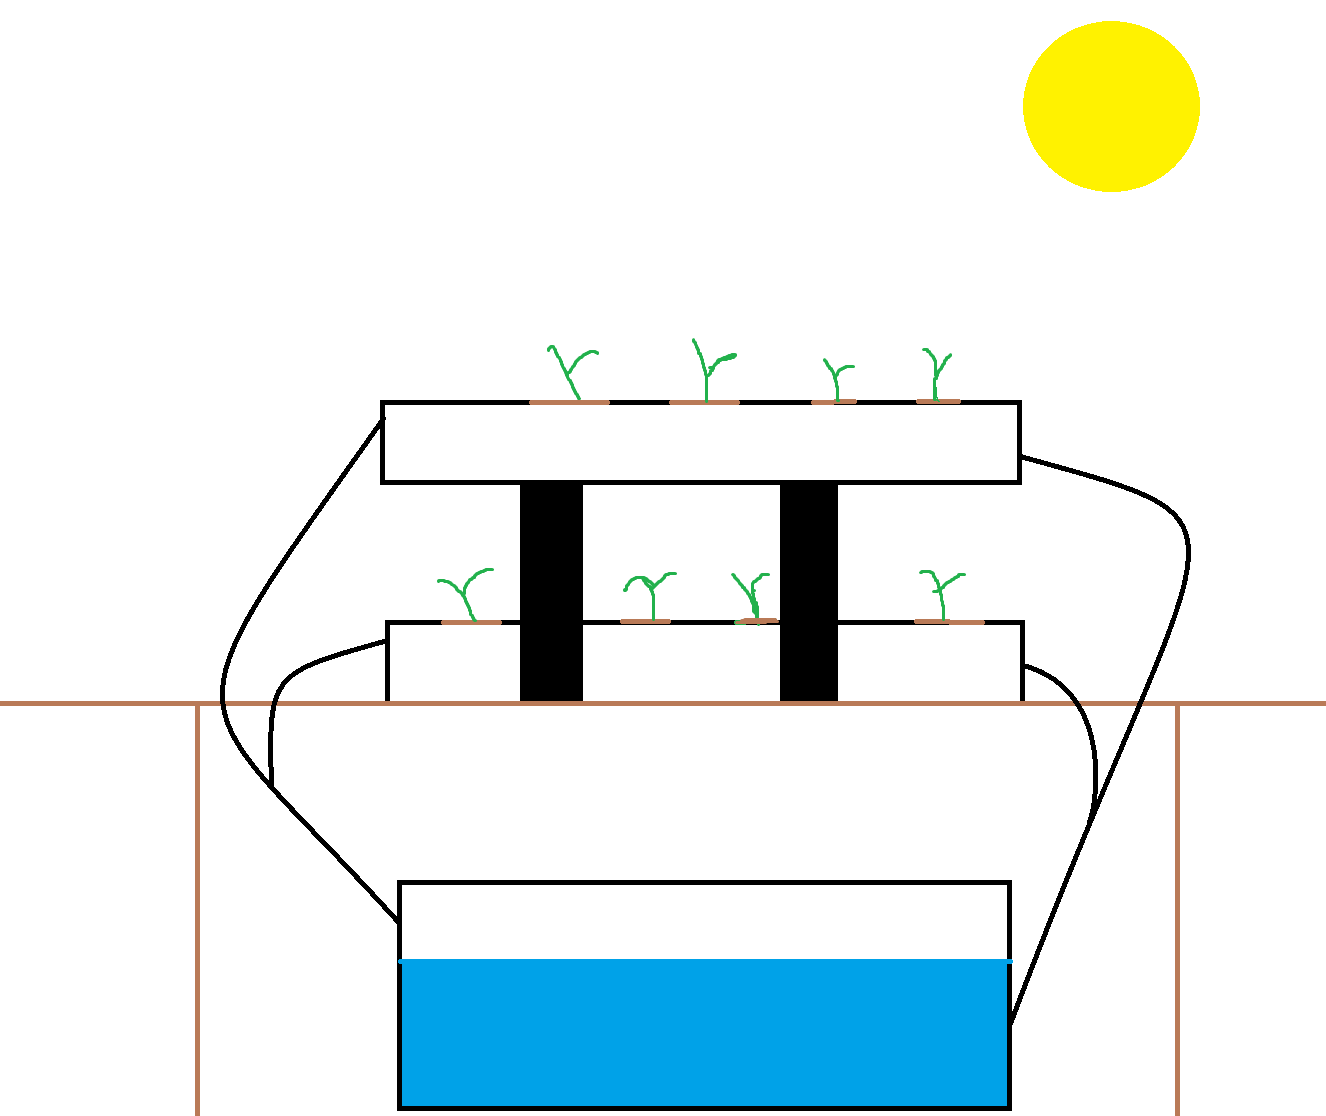
From figure 1 it can be seen that our design makes use of 4 pieces of square PVC, a reservoir for holding a majority of the water, tubes for supporting water flow between the reservoir and the bays,
and finally connectors to mount the tubes into the square PVC. With this initial design we had set out to find the parts required to build it. One of the first things we noticed was that PVC itself was
fairly expensive. This was the main reason why we chose to downscale our project from 12 plants to 8 (allowing us to move from a 3 tiered to 2 tiered system). For our reservoir, we chose to make use of a
cheap storage bin, as products labeled as "tanks" or "reservoirs" were often much more expensive (in the $40+ range). This allowed us to save enough money to create an actual tiered system. The rest of the
parts for the physical structure including the connectors, pump, and tubing were sourced from previous projects our group had worked on. This allowed us to save time in acquiring these components, but presented
some challenges during the build process.
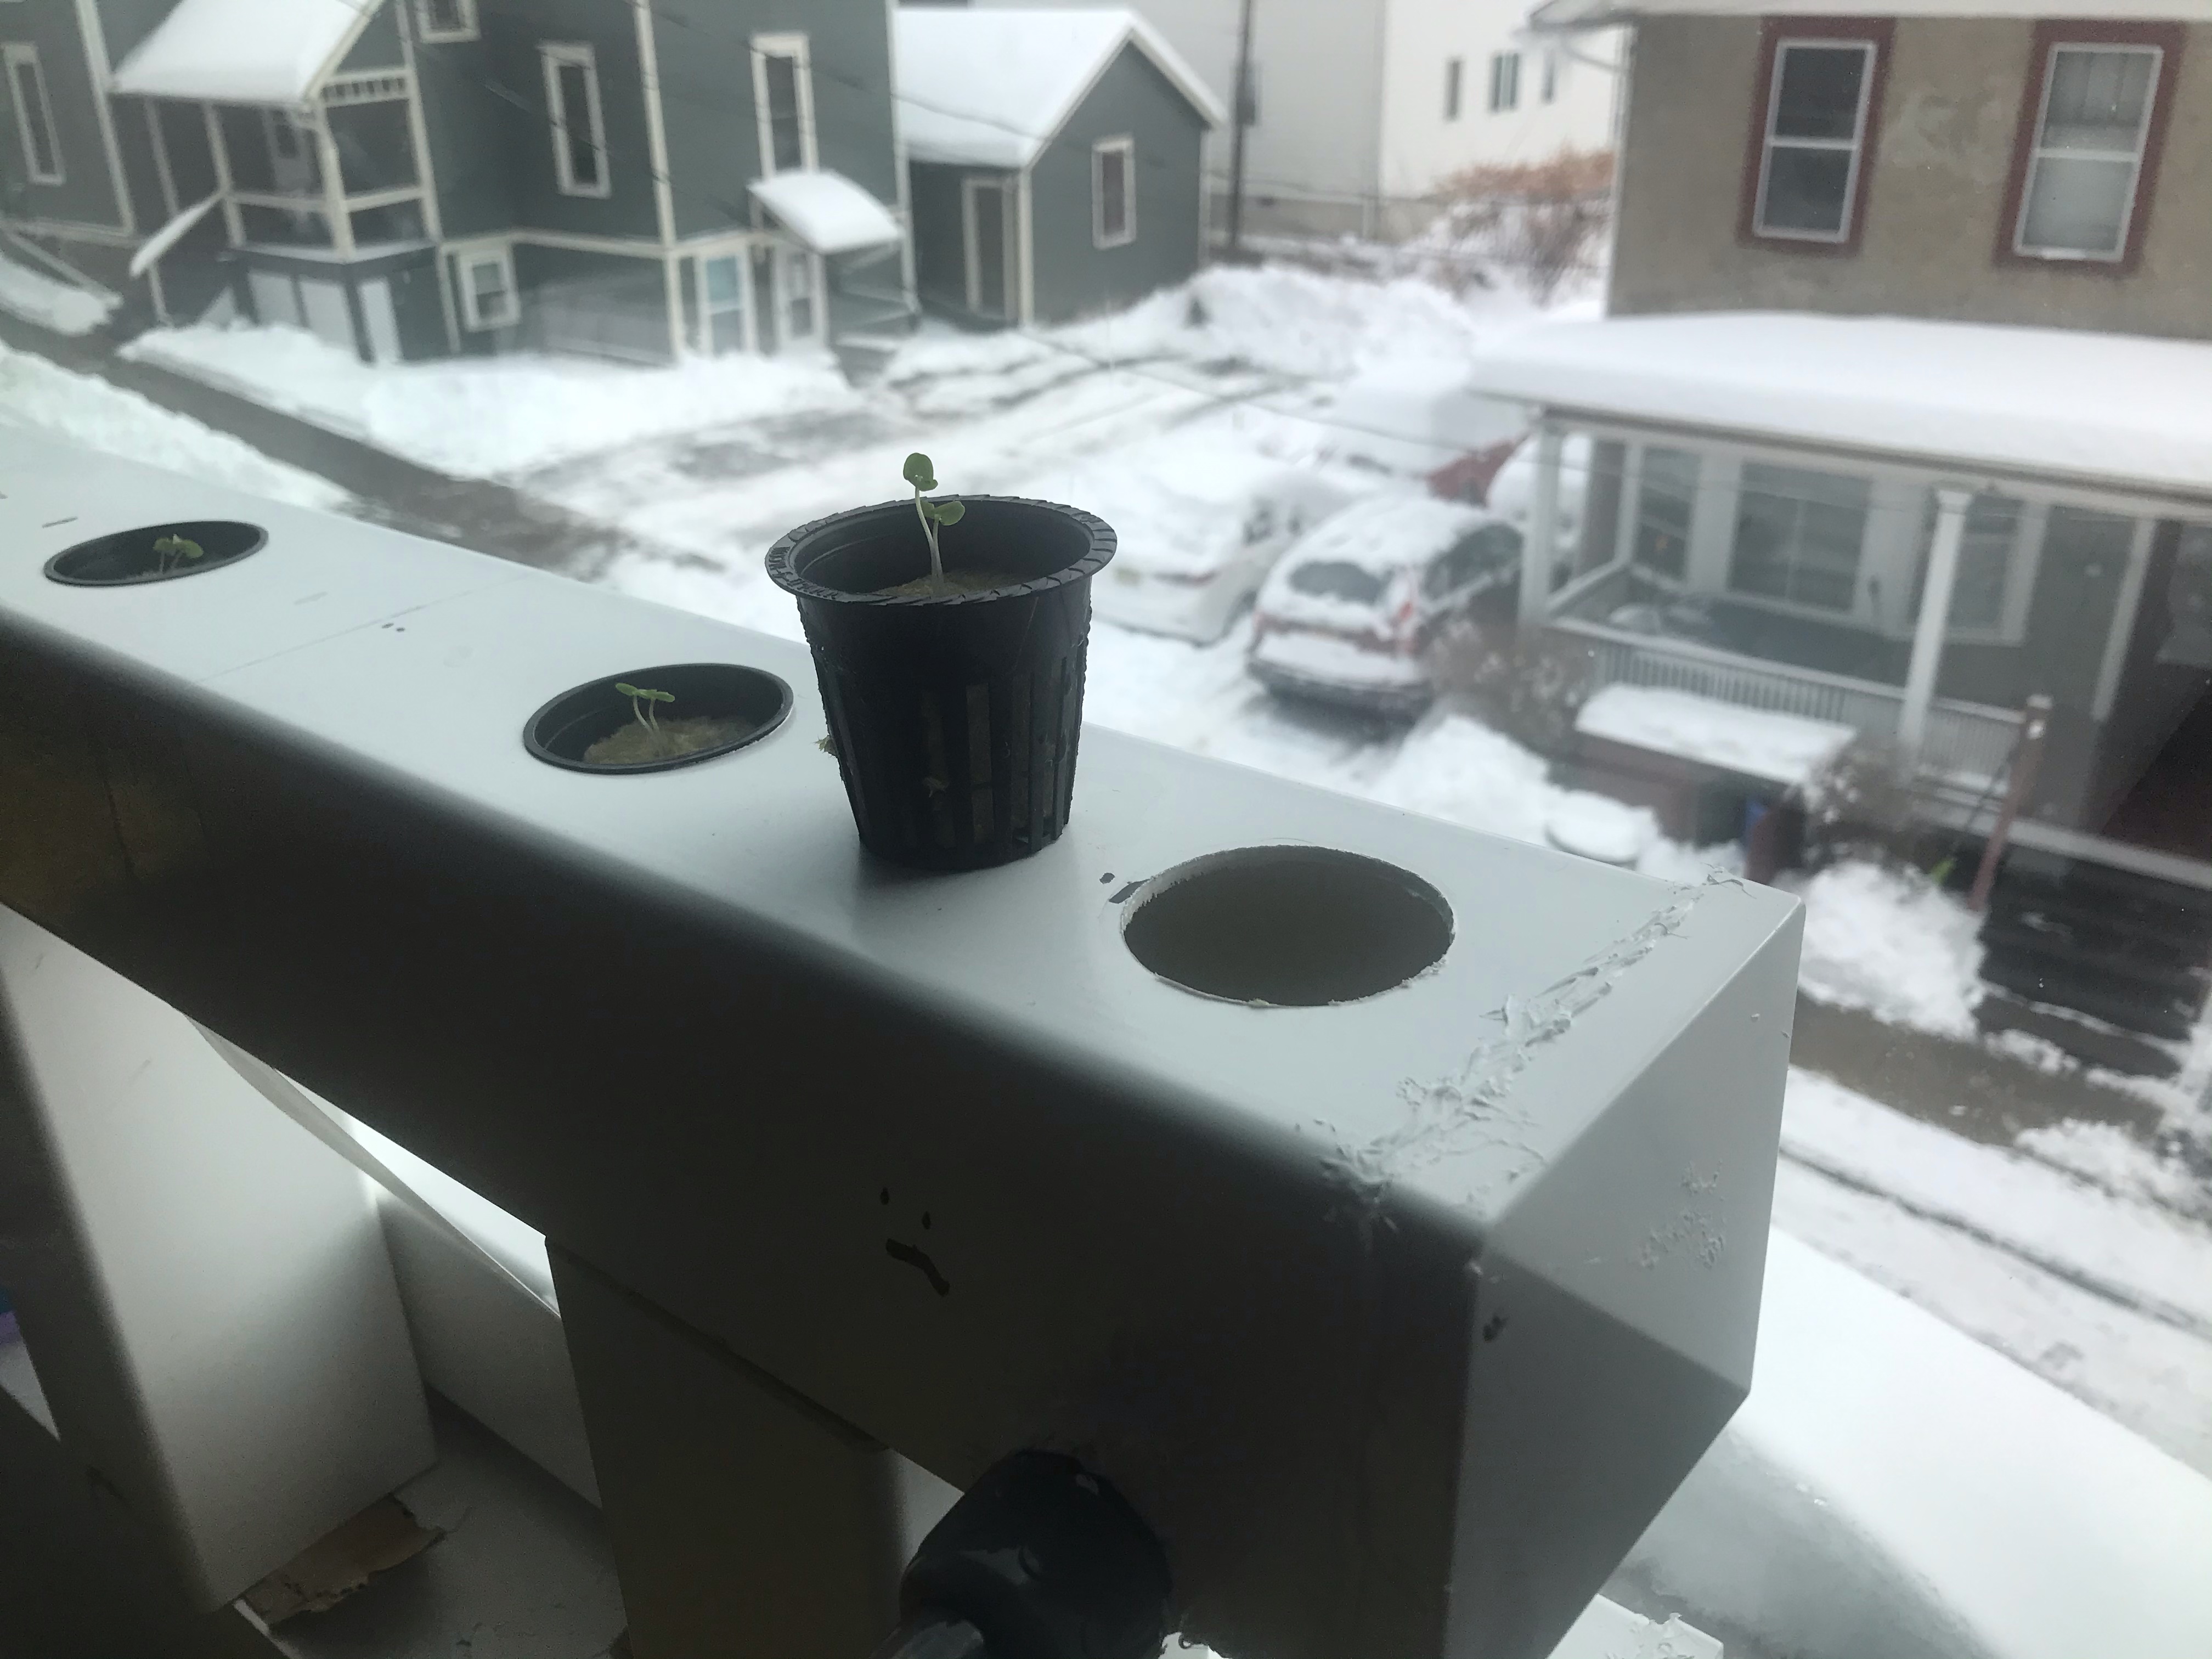
With all of the components acquired, we moved on to building the physical structure. The first step in this process was to drill the holes on the top of the PVC which would be used to house the plants themselves.
To accomplish this we first marked out four evenly spread locations on each PVC post, and then made use of a drill to bore out each hole. This was probably the easiest part of the build process as we had a component for the
drill capable of creating holes that were just the right size to fit the netcups. These holes can be seen in figure 2. With the plant holes drilled, we then moved on to drilling the holes for the input and overflow connectors.
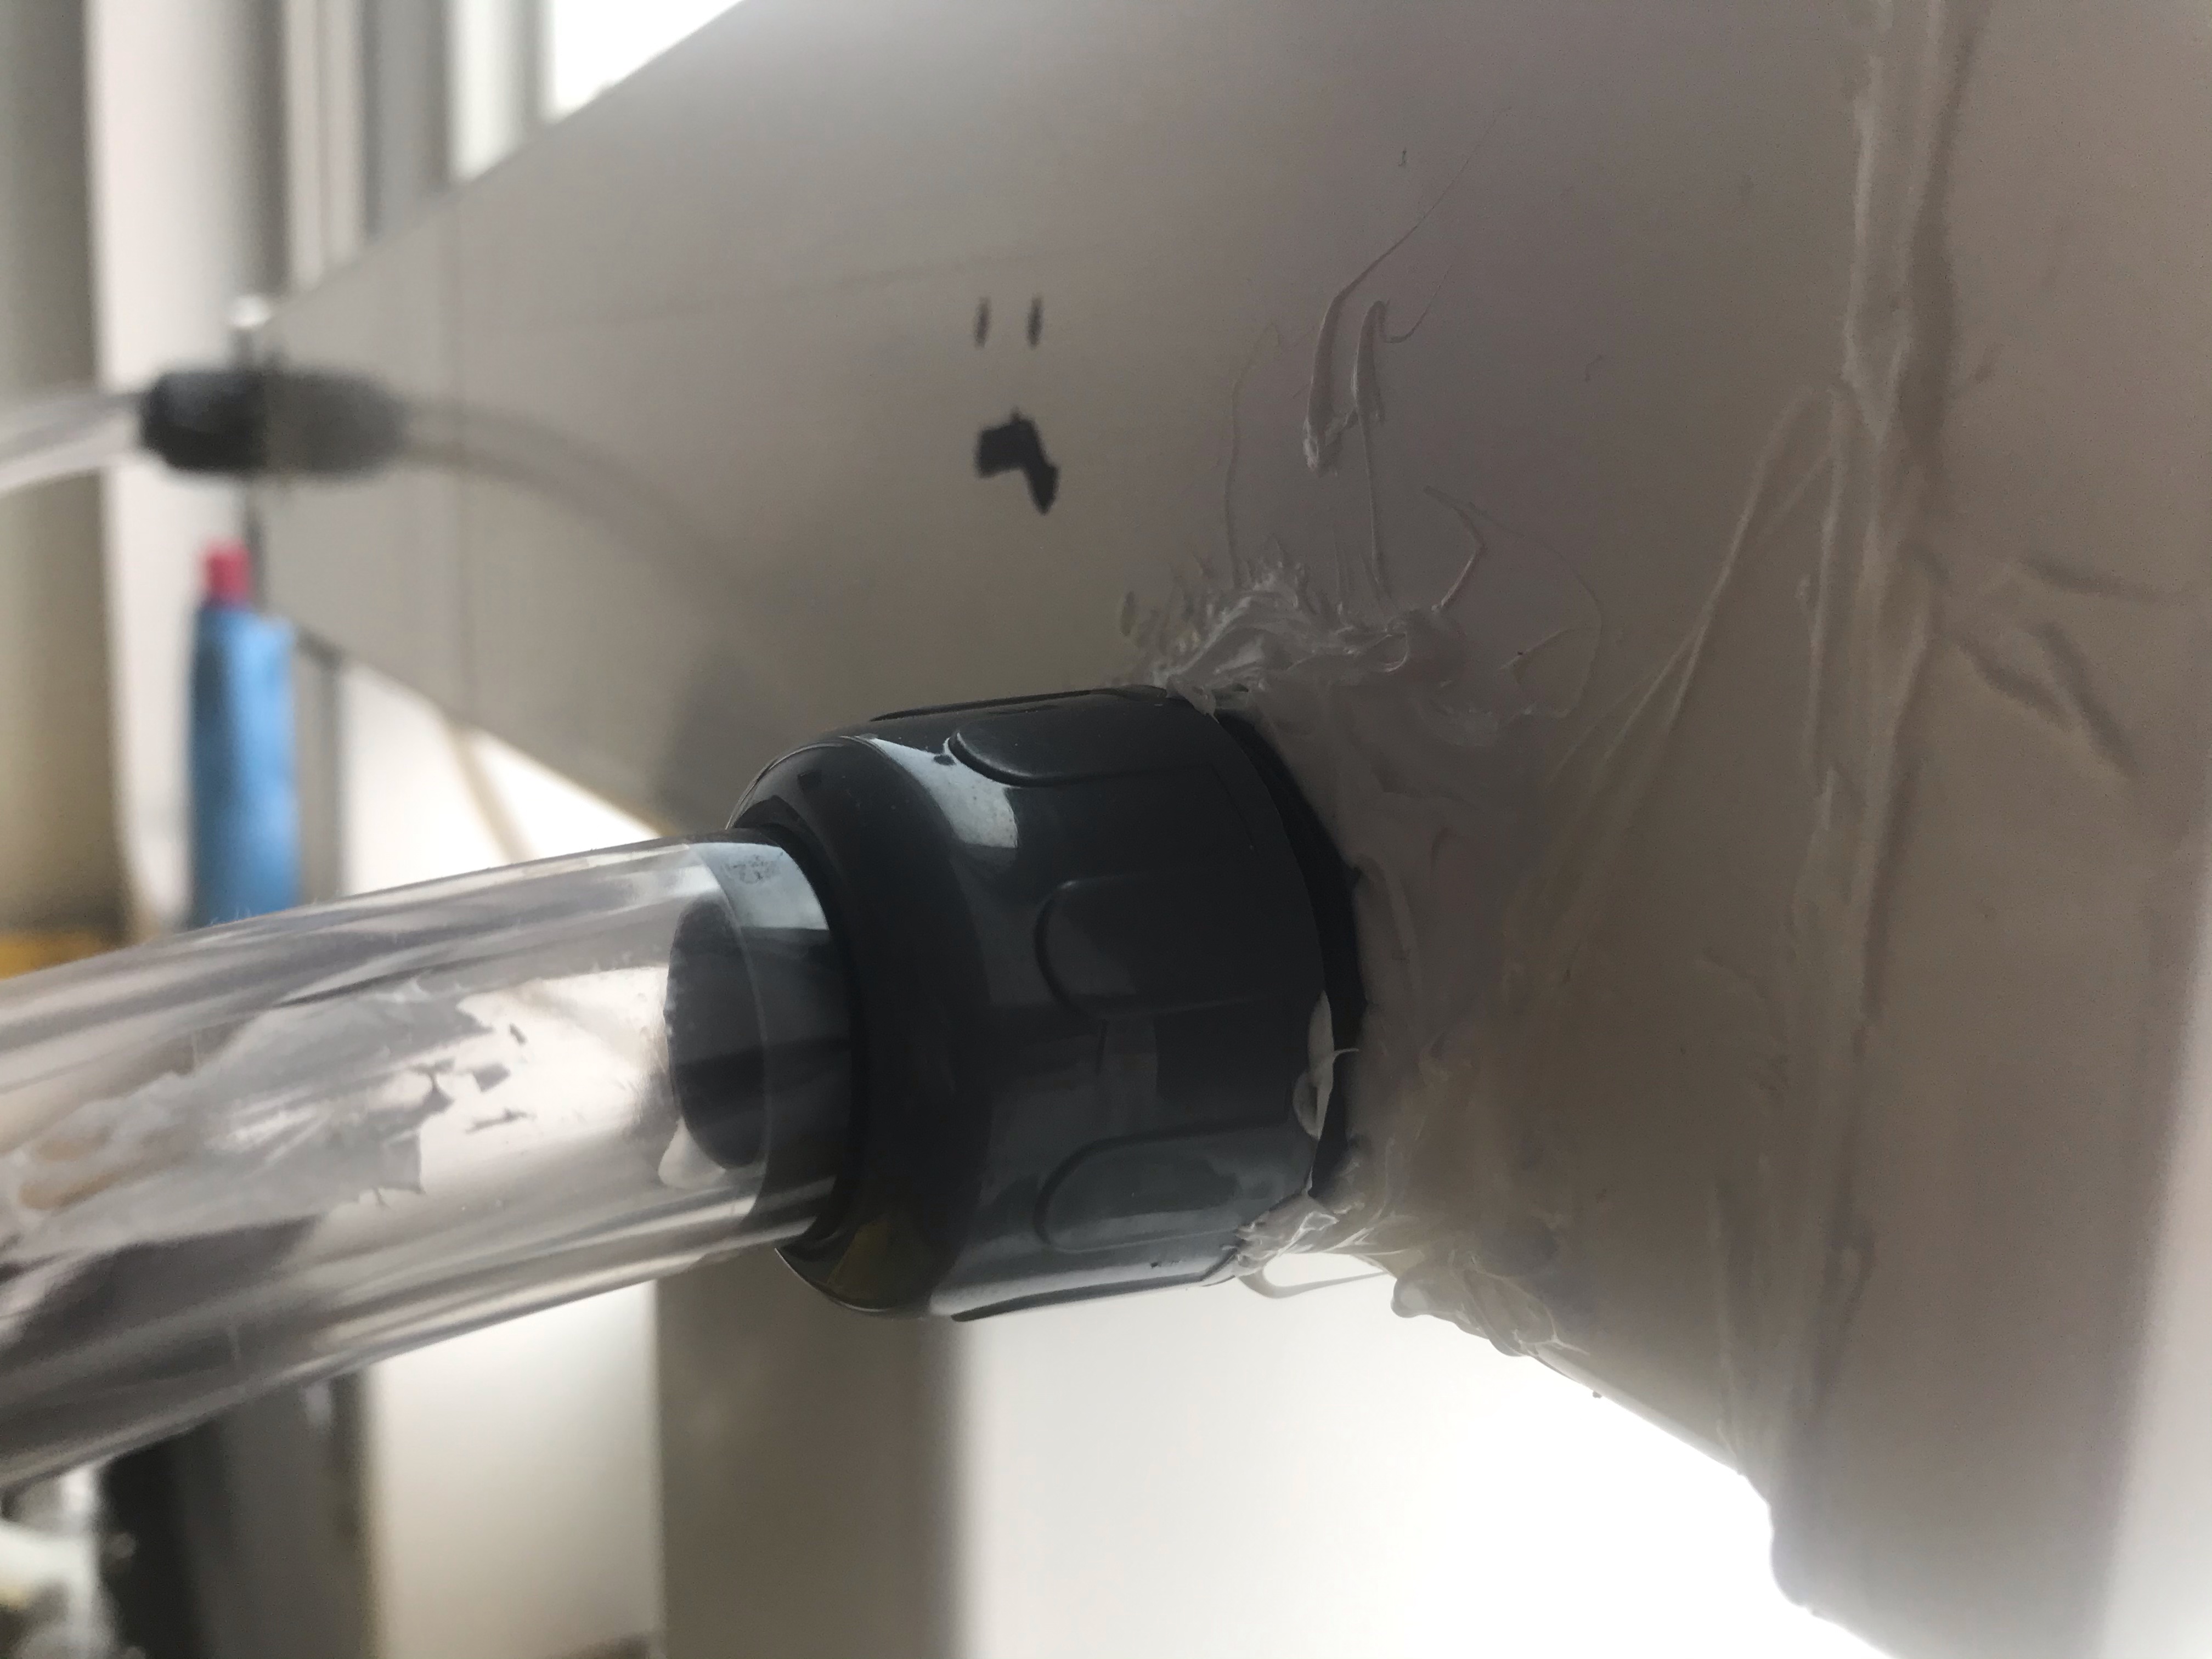
One of the issues we ran into when designing the physical structure was the fact that there aren't any "native" connectors for square PVC. As such, we decided to make use of a set of circular
connectors which would be attached by drilling a hole into the side of the square PVC post and then would be screwed in (seen in figure 3). These connectors also featured O-Rings which we had hoped would be enough to create a
water tight seal. Unfortunately, we did not have a proper sized drill bit nor did we have the budget to buy one; as such, we had to resort to widening the holes manually with a smaller drill bit. While this
did allow us to create a hole wide enough to fit the connectors, it ultimately created non-perfectly circular holes. These holes would create a small problem later on.
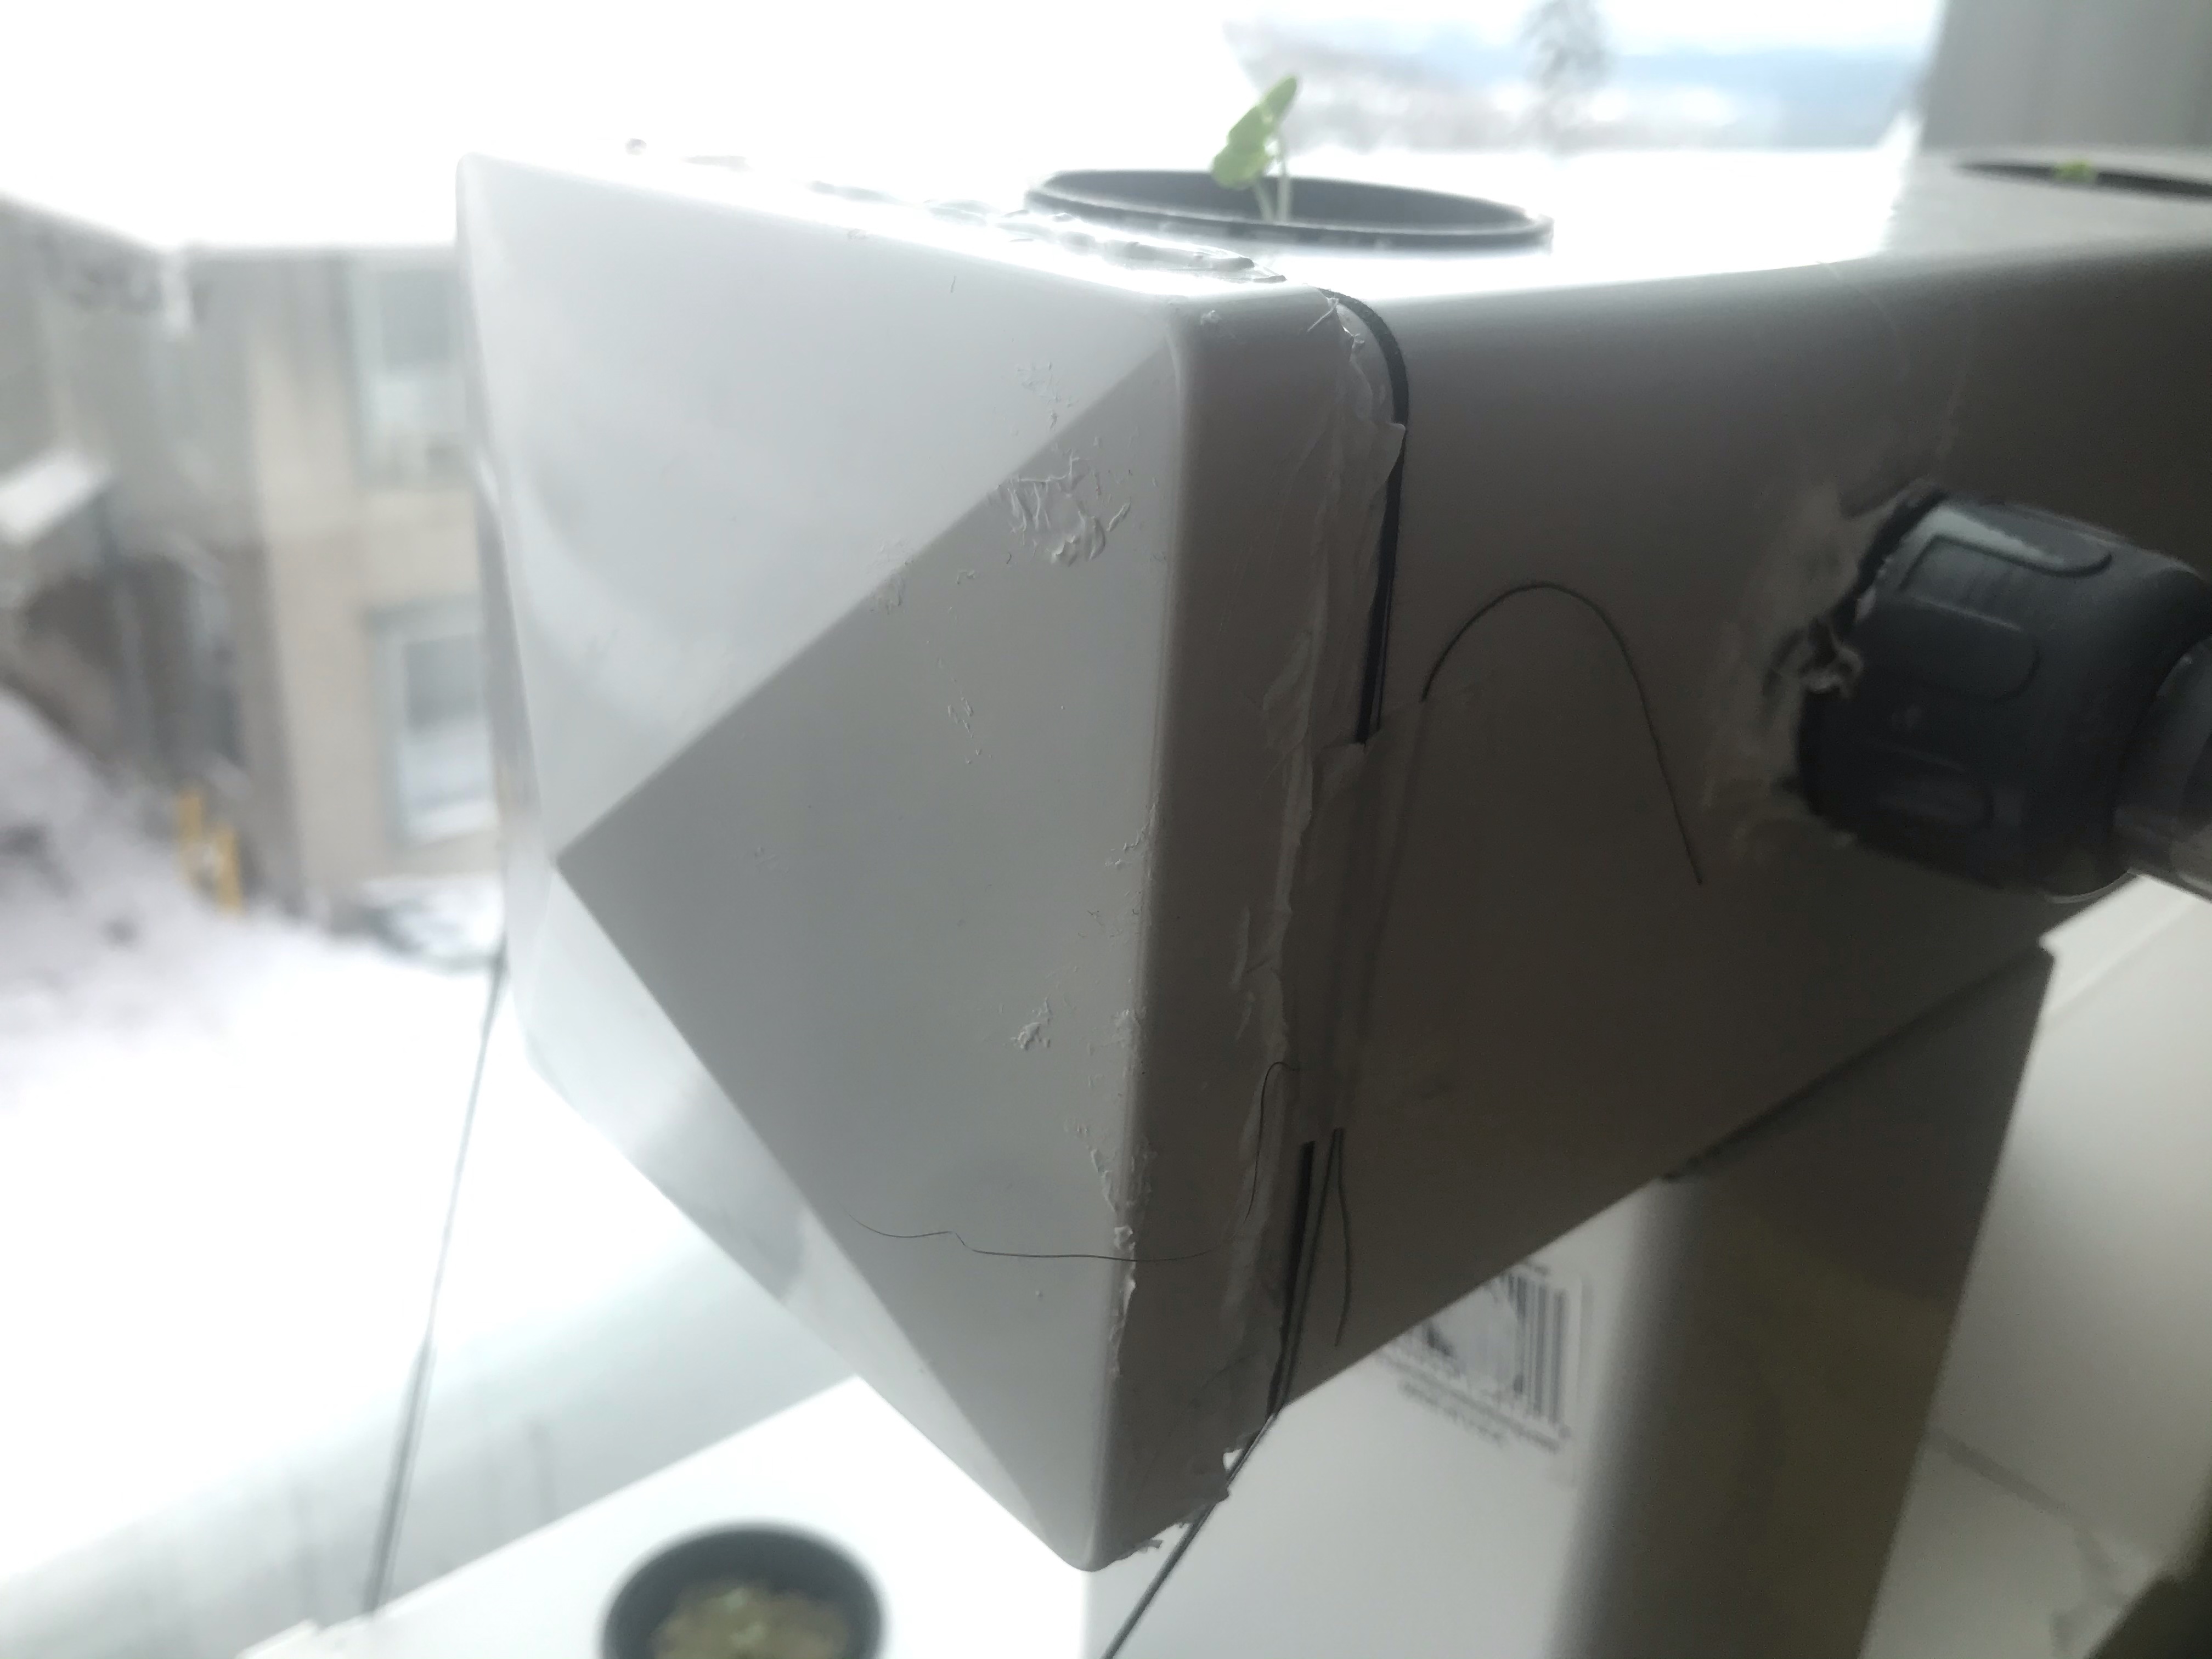
With the connectors attached, we now needed to begin sealing the PVC posts. To accomplish this, we made use of square PVC fence post caps seen on the ends of figure 4. To ensure a tight seal we first used
PVC cement to firmly attach a cap to each end of the fence post. After waiting the 30-minute curing period, we then used silicon based caulk to "seal" the outside edges of each fence post. The silicon based caulk we used
was meant to be "fast-curing" while a cure time of only 30 minutes. As such, after about 30-minutes we decided to test the bay for any leaks. This test was performed by connecting a hose between the inflow and overflow
connectors and then slowly filling the PVC post using water from a pitcher. Unfortunately, as alluded to earlier, the manually widened holes used for the
circular connectors came back to haunt us, as both holes sprung a small leak. We had initially hoped that this was simply a matter of the seals not being tight enough, but with the PVC caps not cemented on, we could
not find an easy way to tighten the seals further. As such, we decided to use caulk in the hopes of creating a water tight seal around each connector. This did seem to work after letting the caulk cure and running the tests again, so
we moved on to performing this same process for the second PVC post. For the second post, we made sure to tighten the seals as much as possible before cementing the PVC caps; however, the connectors still leaked regardless.
With the PVC posts now tested and no longer leaking, we now needed to assemble the system. To accomplish this, we made use of the PVC cement once again to cement the two supporting posts seen in figure 5 to the bottom of one of the PVC posts.
Once the cement dried, we then attached began to connect the tubing for the inflow and overflow connectors. During this process we found that the tubing was much more rigid than we initially expected which resulted in a number of issues. The first
issue was that once connected to the reservoir, the tubing was practically attempting to pull the PVC structure off the windowsill. To remedy this issue, we chose to use thread and tape to bind the top PVC bay to the bottom one. This added
a fair amount of stability when combined with some sort of weight added to the bottom post. Initially, we used a bottle of laundry detergent as weight, but once the system was filled with water, we found that this was no
longer needed. The other issue we found was that the rigid tubing was attempting to twist the caulk on the connectors while we were setting up the tubing system and attaching it to the pump. We we initially worried that this would cause a hole in the
caulk to be formed, resulting in a leak. However, after a period of 24 hours, the caulk became much more rigid, and this proved to not be an issue. To test for leaks here, we initially used the pitcher to fill up each PVC post slightly beyond the
inflow connectors. This allowed us to ensure that there were still no leaks in these connectors after assembling the tubing system. From here, we used the pump to push water into each PVC post until the point where the water began to flow out of the overflow
connectors. This allowed us to confirm that the system could withstand the force from the pumped water as well as that there were no leaks in the overflow connectors. With this test complete, we could now move on to setting up the pH and ppm sensors.
Sensor Design and Testing
One of our goals for this project was to be able to provide enough feedback to a user that they would have an understanding of the state of their system, and what needed to be added to it in order to ensure plant growth. As such, with our limited budget, we chose to
acquire a pH sensor, PPM sensor, and a relay. The PPM sensor allows us to provide feedback on the amount of nutrients in the water. This allows the user to know when more nutrients need to be added based on the type of plant they are trying to grow. Additionally, the pH sensor provides
feedback on the current pH levels in the water. This is necessary as each plant has a different pH range they tend to grow best in. Adding things like additional water or nutrients can drastically alter the pH levels, and as such we felt it was important to allow a user to
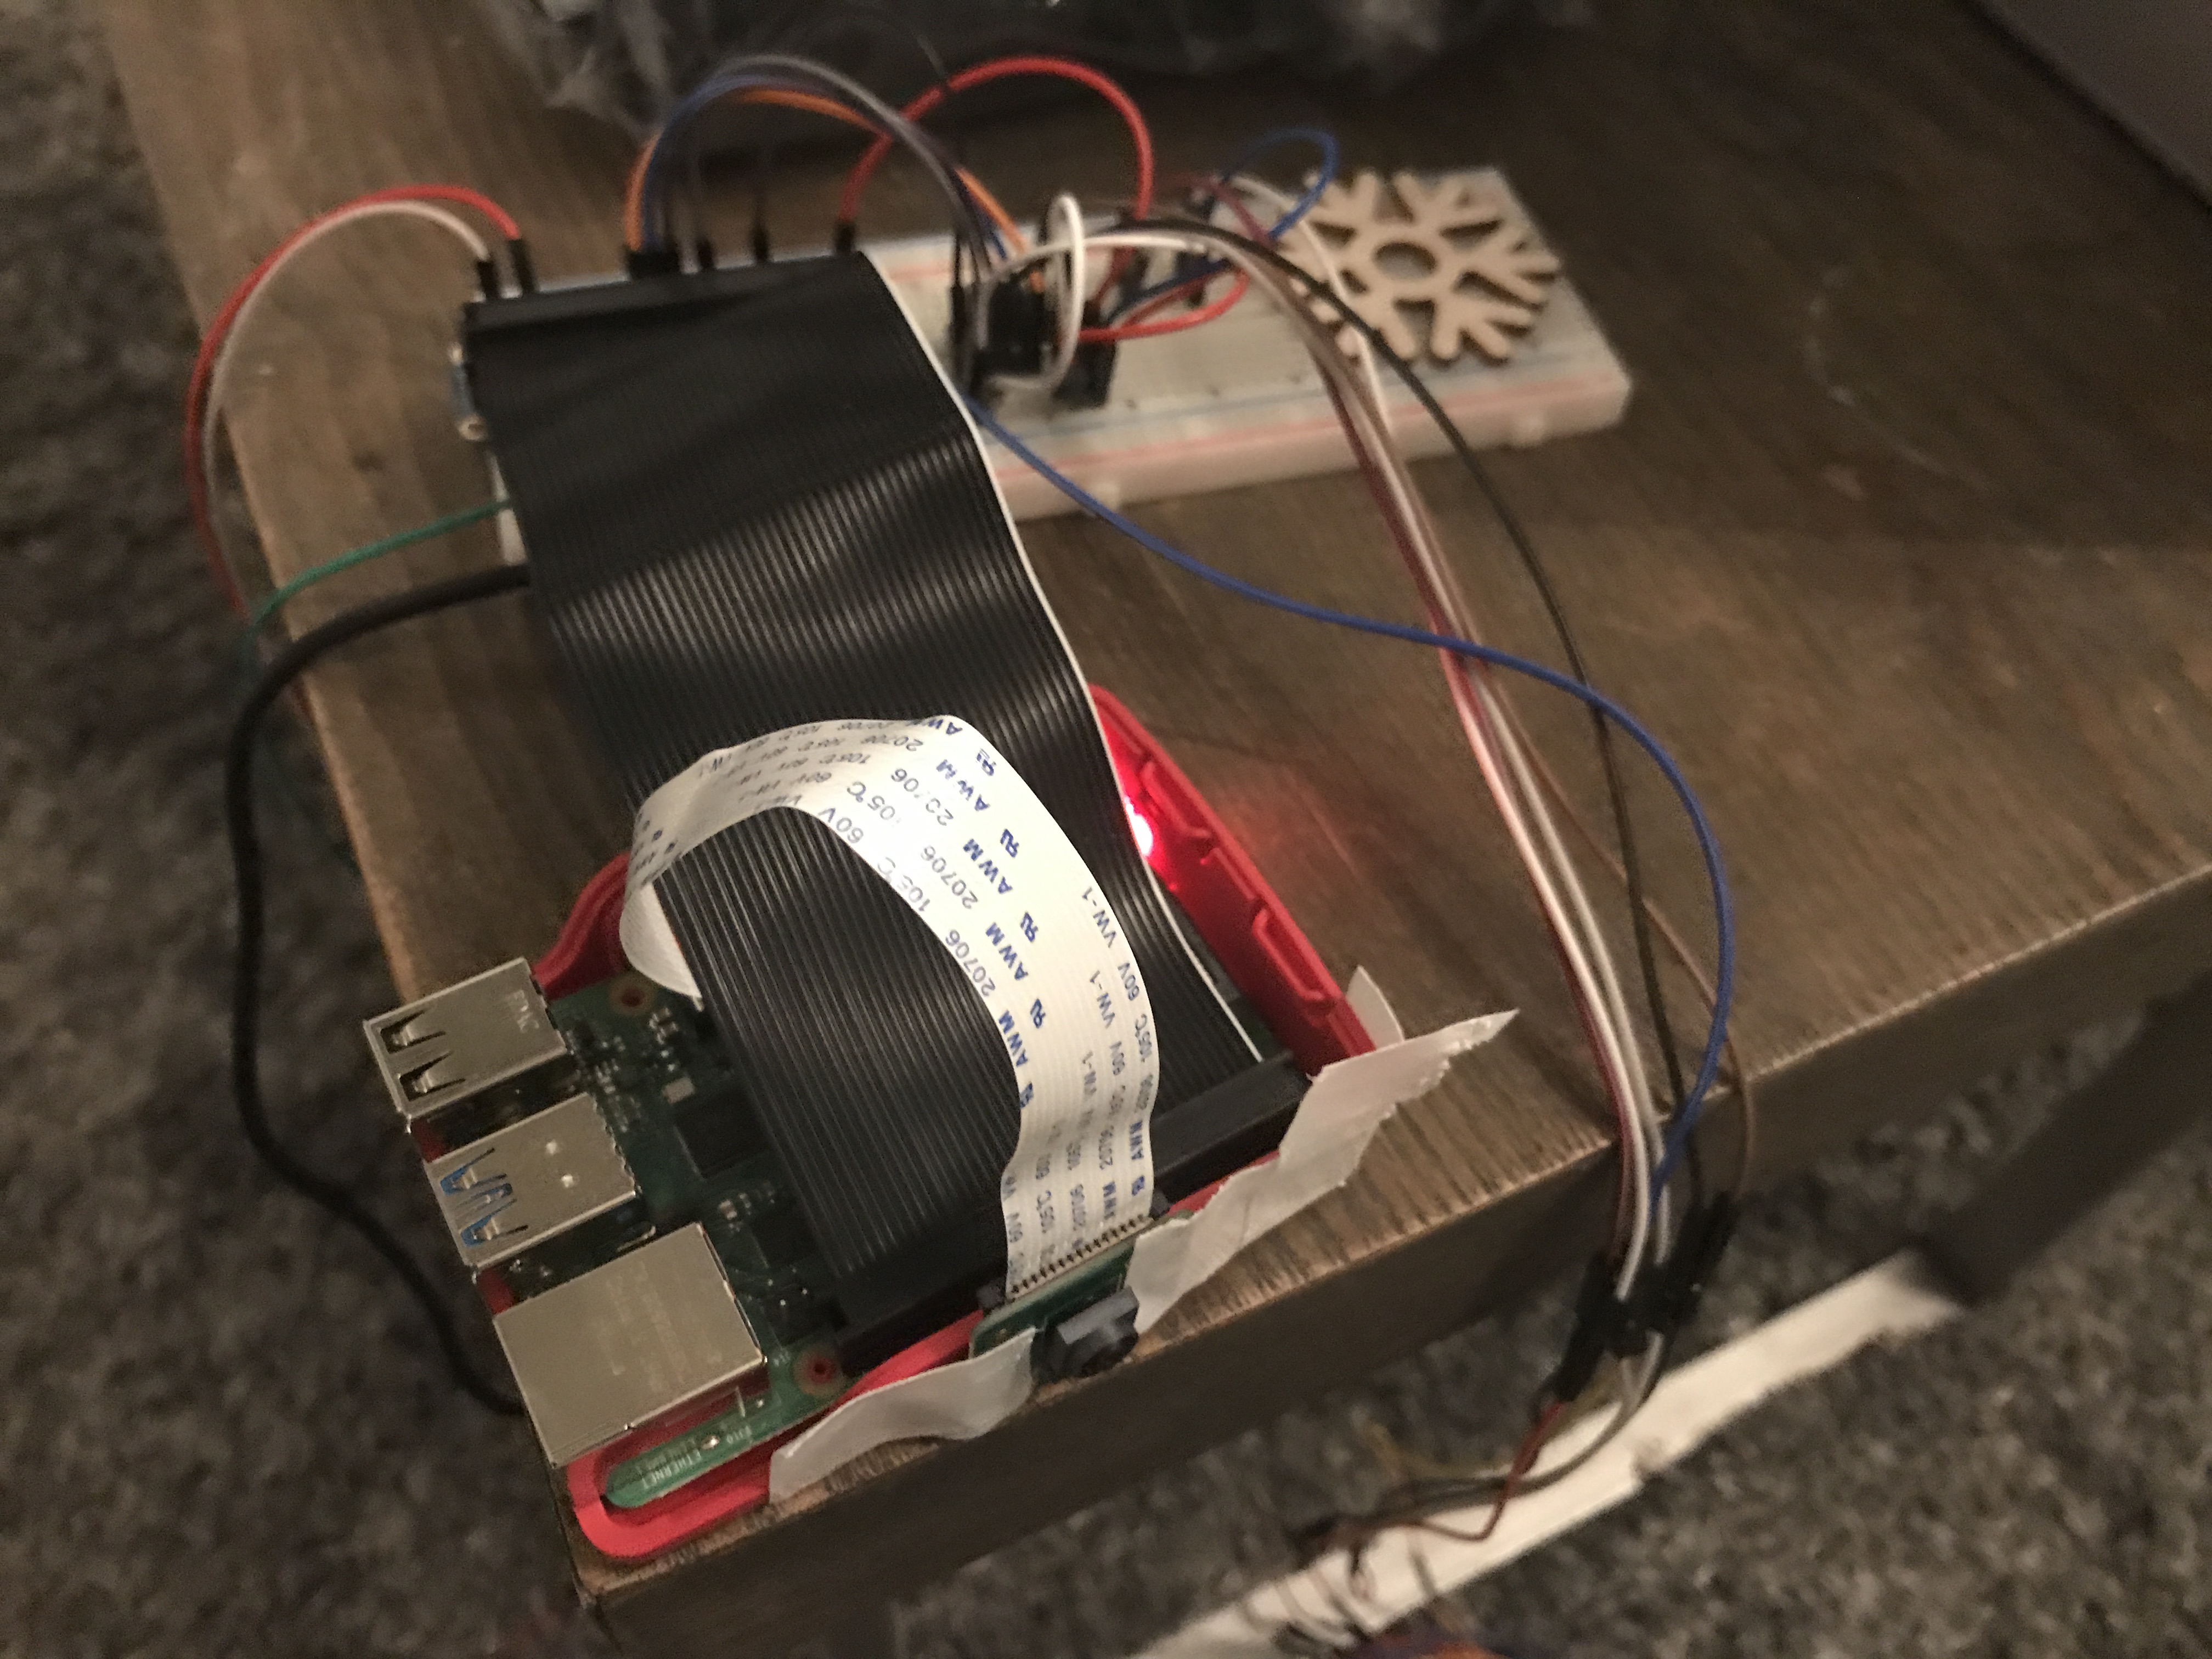
know what the current pH is without needing to be physically present with a pH strip or some other form of tester. An image of our sensor setup with the raspberry pi can be seen in figure 6.
For choosing sensors, we wanted to find a pH sensor that was capable of providing relatively quick updates (settle time of less than a minute) and a PPM sensor capable of measuring to at least 1000ppm. We wanted a sensor capable of 1000ppm as the nutrient requirements of basil range from 800ppm to 1200ppm. The two sensors we eventually chose met this criteria and can be
found in the parts list later in this report. The PPM sensor we found is produced by seeeduino and as such is already limited in output voltage to a max below 3.3V. We had hoped to also use the pH sensor made by the same company; however, they were out of stock and so
we were forced to find a different option. Unfortunately, the alternative we found within our price range has a maximum output voltage of 5V which created some issues later on in the design process.
Originally, when we began to integrate the sensors into our system we had not realized that the Raspberry Pi does not have any analog I/O pins. This posed a problem to us as both the sensors we are making use of provide an analog output. As such, we bought a 10-bit ADC
from adafruit which we could use to convert from the analog outputs of each sensor to a digital one. The ADC we chose uses SPI as its method of communication. As we did not intend to use the PiTFT for this project, we removed the drivers and code associated with the PiTFT to
ensure the SPI lines would be free. To interface with the ADC we chose to make use of the adafruit_mcp3xxx.mcp3008 library. This library handles communicating to the ADC and reading the values from the desired channels. Something important to note here is that the library outputs
ADC values as if we were using a 16-bit ADC. As the ADC we chose to use is only 10-bits, we right shift the values by 6 to ensure they are in the proper range. The code we used for collecting values from the ADC can be found in the appendix (adc.py). Something to note about our code
is that we set the max ADC value for the ppm sensor to 713 rather than 1023. The reason we did this is that the maximum output voltage of the ppm sensor is only 2.3V. As such, the maximum ADC reading it can ever generate is 713 and so we want 713 to represent 1000ppm. Likewise, the pH
sensor uses a conversion to a range of (3-14pH). This is due to the fact that beyond 3pH the sensor outputs a voltage above 3.3V and as such, we didn't want the rest of the scale to be affected.
To test that these sensors were functioning properly, we made use of the same script adc.py script mentioned previously. To start off we began by testing the pH sensor. We decided to use tap water as our base and wound up with a result of around 8pH.
From here, we placed the sensor into a container of lemon juice and recorded the result. The pH of lemon juice should be between 2 and 3, and the result we received was around 3 which makes sense as that is the lowest pH we could measure
with a 3.3V ADC. To test the ppm sensor we followed a similar process. We first placed the ppm sensor into a container of tap water and received a result of around 100ppm, which is the average ppm of tap water. From there, we added some nutrients to the water and observed
both the increase in output voltage, and also a result of around 400ppm, which is around what we expected based on the amount of nutrients added.
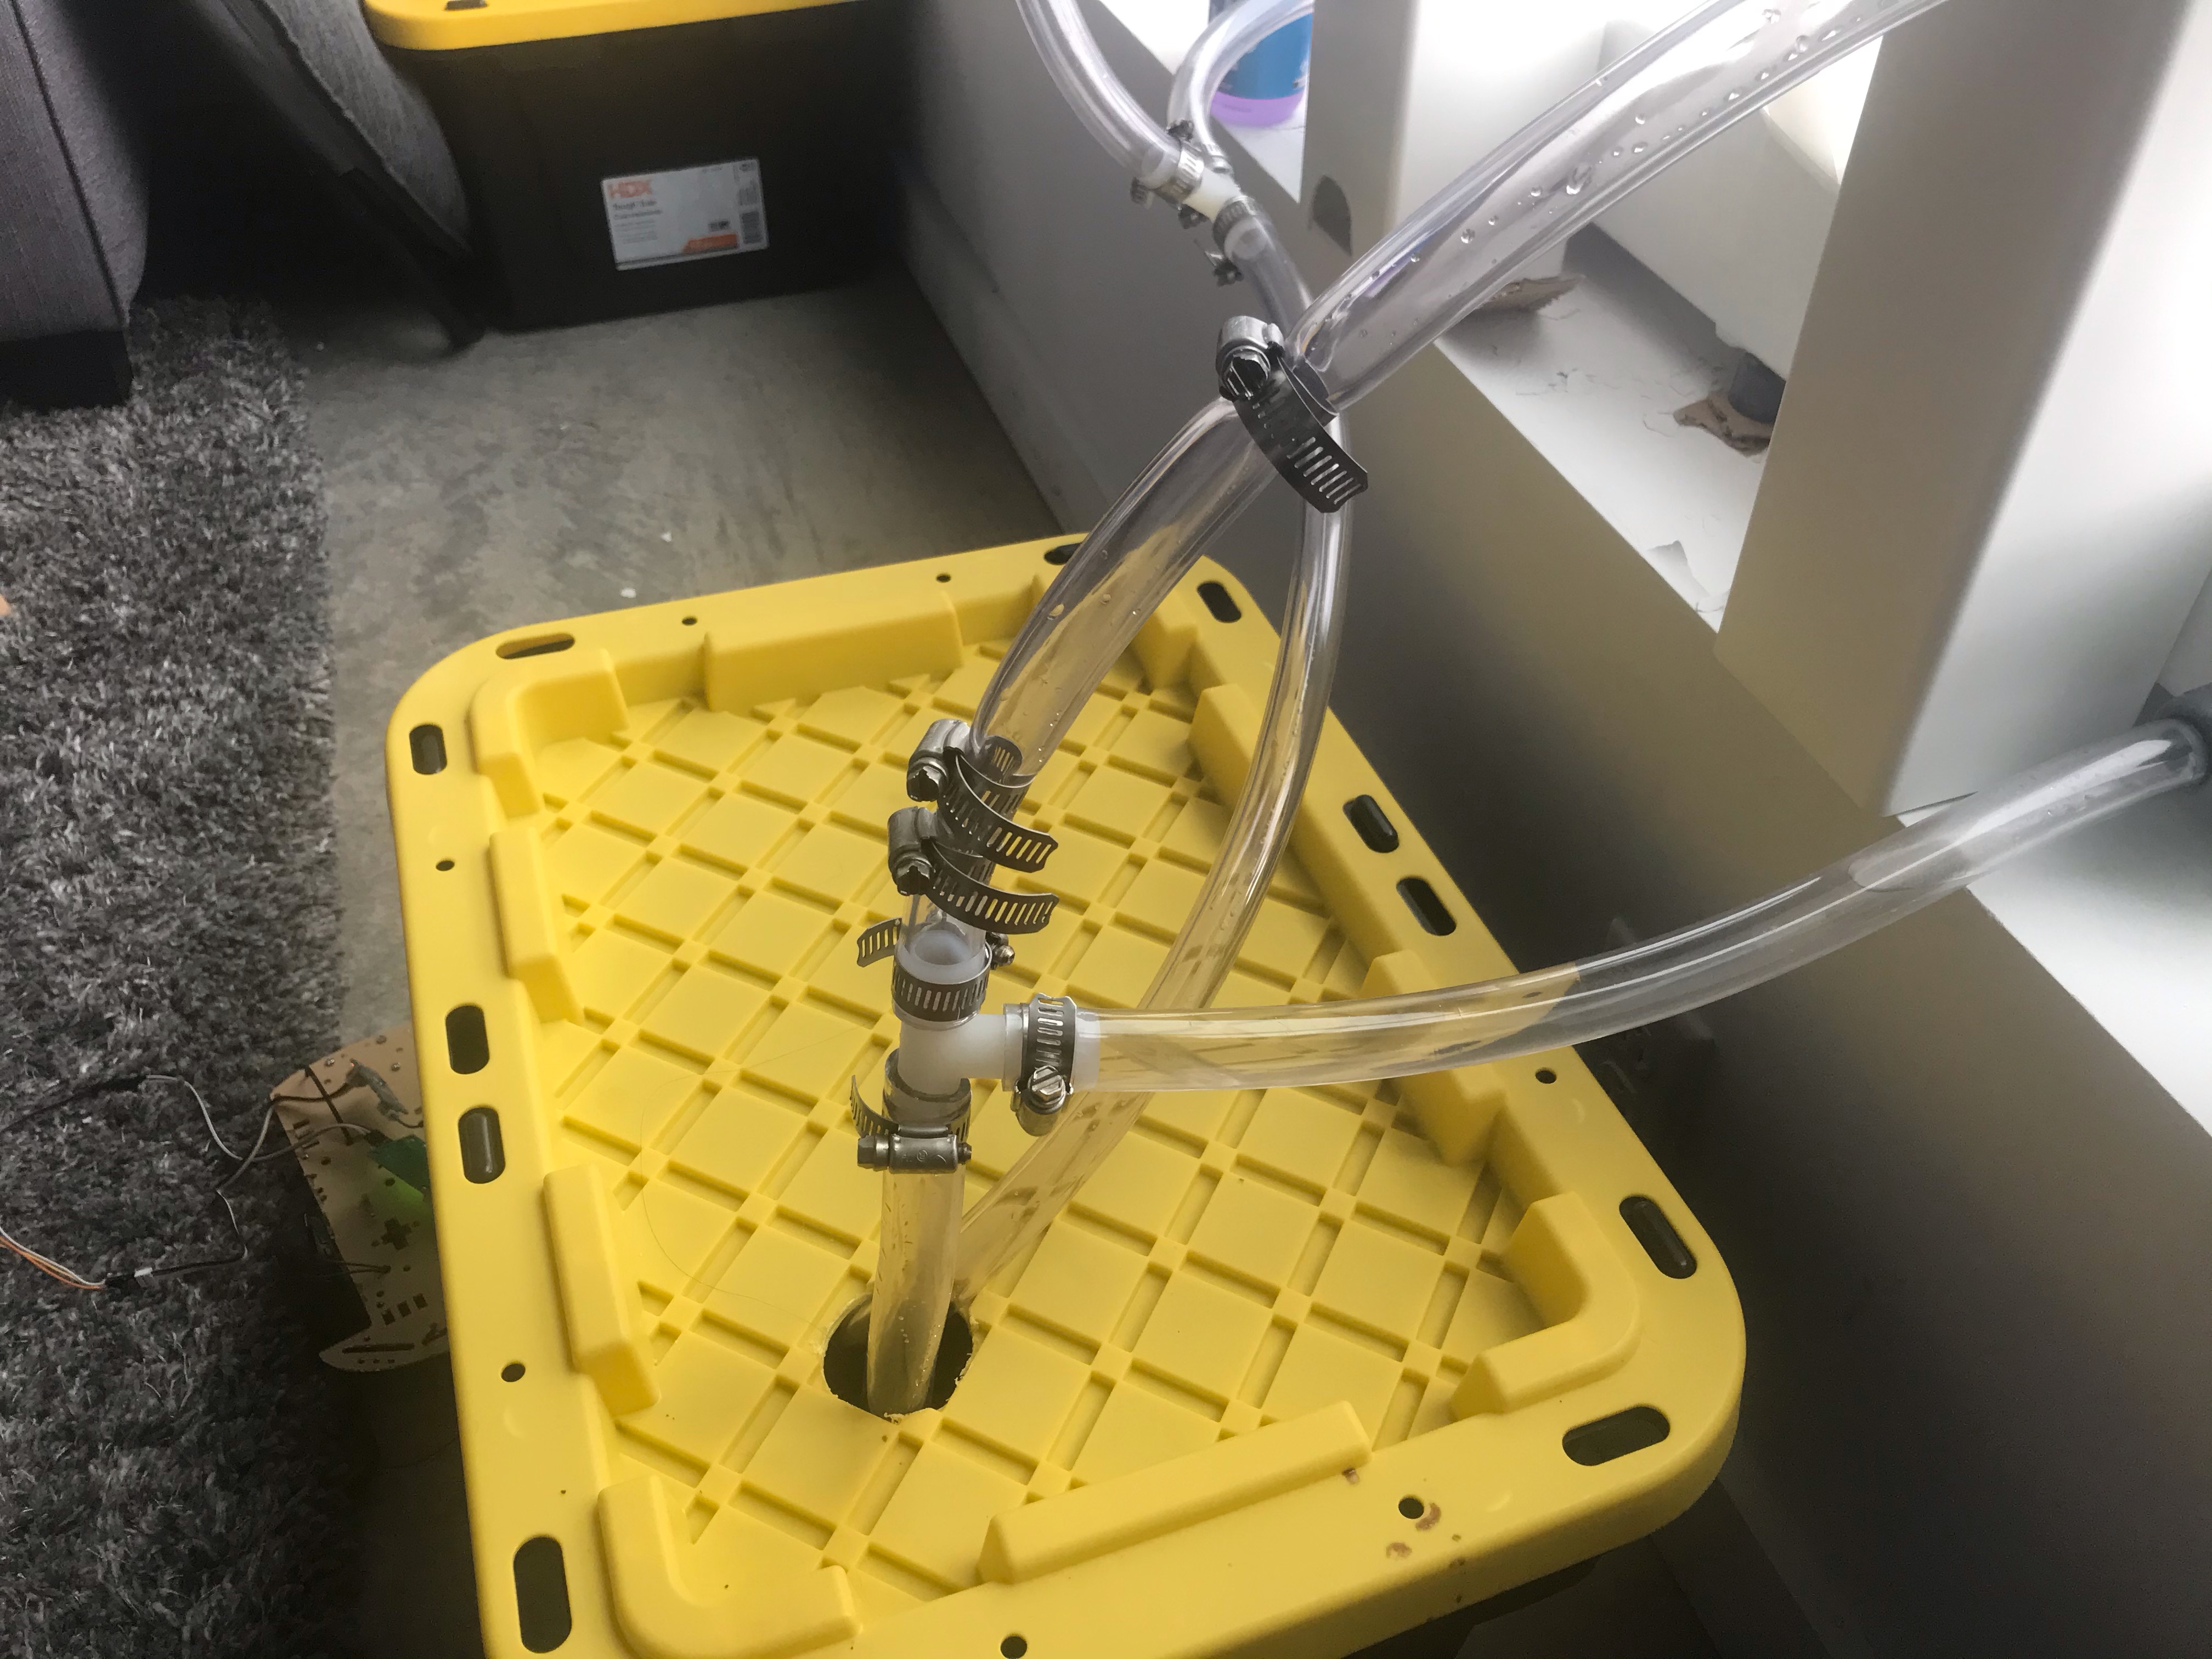
With the two sensors tested and ready, the final thing we needed to setup was the relay and timing for the pump. This was a little more difficult than expected due to the way we setup the tubing initially. The original idea was to simply activate the pump using a relay for a designated period of time and then have it off for a number of hours. However, due to the nature of the tubing, we were finding that the top bay was filling up relatively quickly compared to the bottom bay. As such, we had to do a bit of trial and error until we found a timing scheme that worked well. To begin with, we added a number of resistive bands to the tubing which can be seen in figure 7. The idea here was that the bands would limit the amount of water which could flow through the tube to the top bay, thus forcing a more even amount of water into both bays. While this had some success, we found it wasn't enough to solve the issue entirely. As such, we also decided to do a sequence of "pulses" from the pump. Essentially, every 10 hours or so, the pump would first run for 10 seconds, and then enter a loop where it would wait for 7 seconds and then run for 4 seconds. It ran 6 of these loops before going to sleep for 10 more hours. These short bursts of water actually did succeed in creating a more even distribution of water.
OpenCV Integration
The system incorporated a piCamera and OpenCV to provide status updates and plant height measurements to the website. The photos are taken on a schedule that we determined based on the
quality of the pictures that we believed we could get. Our goal with the images is to have no green elements in the photo besides the plants, allowing for them to be easily identified.
To this end, we chose to take the photos at night. The system sits on the window, so at night the background is dark.
Once the image is taken, it is first spliced into eight separate images, one for each plant. Next, the following procedure is applied to each new image.
The process starts by converting the image into the HSV color domain. The reasoning behind this is that by using this color scheme, we can more easily define color thresholds that cover all
intensities of a given color. Once the image has been converted to this domain, the script then thresholds the image to remove all parts of it that aren't within a certain color range. In the case
of the plants, this removes everything that isn't green from the image. Now we are left with an image that is black and white. All the previously green parts of the image have become white, and
everything else has become black.
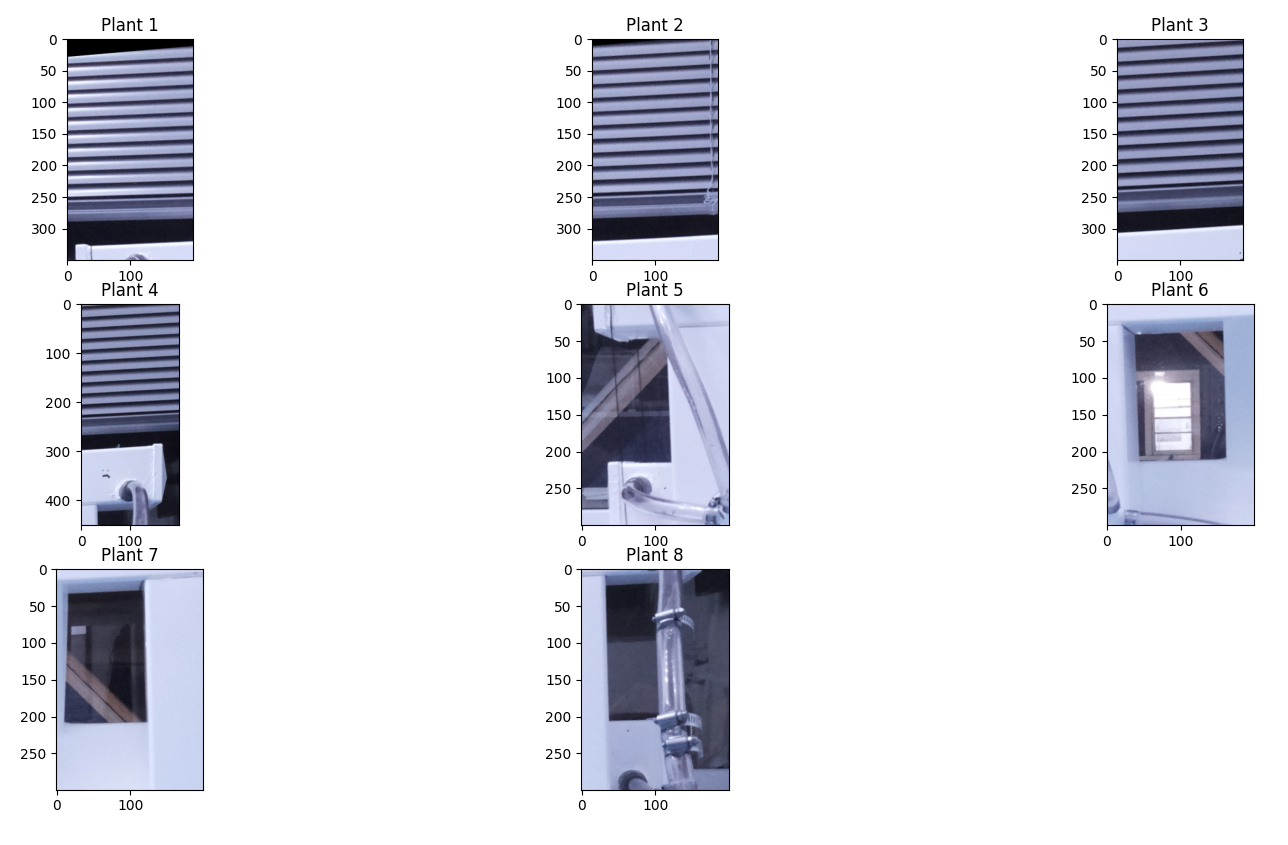


At this point, we can run a function to calculate the height of the plants. To do so, we search through each of the eight images and look for white pixels. Upon finding one, we search upwards
until we cannot find anymore, keeping track of how many times we move up. This gives us a rough estimate of the pixel height of the object seen by the camera. Using an conversion factor determined
by comparing the known lengths of real objects to their reported pixel lengths, we were able to develop an equation that converts each of the reported pixel lengths into a height that is
appropriate for the plant being considered.
The normal images are uploaded to the website under the dashboard section. These are meant to be used to keep an eye on how the system, and the plants, are doing in the event that you are away
from home. A secondary function of this feature is allowing for a timelapse of the plant growth to be constructed from the individual images. The reported heights of each plant is graphed on
the website, allowing for the growth of each plant to be tracked. This allows for one to not only record how their plants have developed over time, but also to look out for wilting as it begins
to occur. Through the graph, a user can tell if a plant has been shrinking over several days, and take an appropriate course of action to remedy the situation.
Website and Database, Design and Testing
One of the goals we made at the beginning of this project was to create a way of allowing a user to remotely monitor their plants. To accomplish this goal we decided to create a website in which someone can view the data collected by
the ppm and pH sensors as well as view pictures of their plants taken by the camera attached to the Raspberry Pi. The first step in creating this website however, was to first setup a database which we could use to store the data collected
by our sensors. For a database we chose to go with postgresql. The main reason for this is that postgresql has a number of relatively easy to use libraries for both python and javascript. As we intended to use both of these languages in this project, we
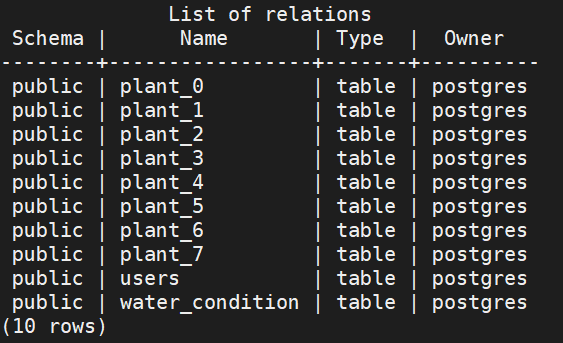
felt like postgres was a solid choice. To begin with postgres we followed the "Install PostgreSQL" tutorial linked in the references section and then created a database called "HMS-database". We then created a table for storing the values collected by the ppm and pH sensor
as well as a table for each plant we were going to be monitoring. This resulted in the database setup found in figure 11.
With the database now setup, we needed to test that we could connect to it from python and javascript. To do this we created the config.py and connect.py files found in the appendix. Config.py handles reading in parameters to access the database which are stored in a separate file (database.ini).
These parameters are then passed to connect.py which uses them to make a connection to the postgres database using the psycopg2 library. Once a connection is made, the library then allows us to issue SQL queries to the database just as you would normally do if you were connected to the database directly.
Queries can be run using the execute function provided by the library. Something to note here is that if you do run a query to insert data into the database, the changes will not become permanent until the commit function is used. Using the combination of these two files, we were able to test that we could
both insert data and read data from the database. Thus, with the database ready to go, we then created a script which would collect data from our sensors every half and hour and store this in the database. This script (data_collect.py) can be found in the appendix and is set to run when the raspberry pi boots.
With the database setup and the sensor data being collected, we then needed to design the website itself. Originally the plan was to create a static website builder using jekyll; however, this idea had a number of issues. For starters, using jekyll combined with apache did allow us to have a working website; however,
there was no easy way to interact with the postgres database. Something we learned during this process is that there are actually two forms of javascript running when interacting with a website. The first is the javascript code which runs within the browser itself. This is called "client-side" javascript, and generally
is used for buttons, animations, and generating html. On the other hand, server side javascript runs in the background, usually when some sort of request is made to the server. Unfortunately, the two versions of javascript are actually fairly different, and client-side javascript by default does not have the ability to form a
connection to a database. As such, we had to restructure our website in-order to provide a method of accessing the database.
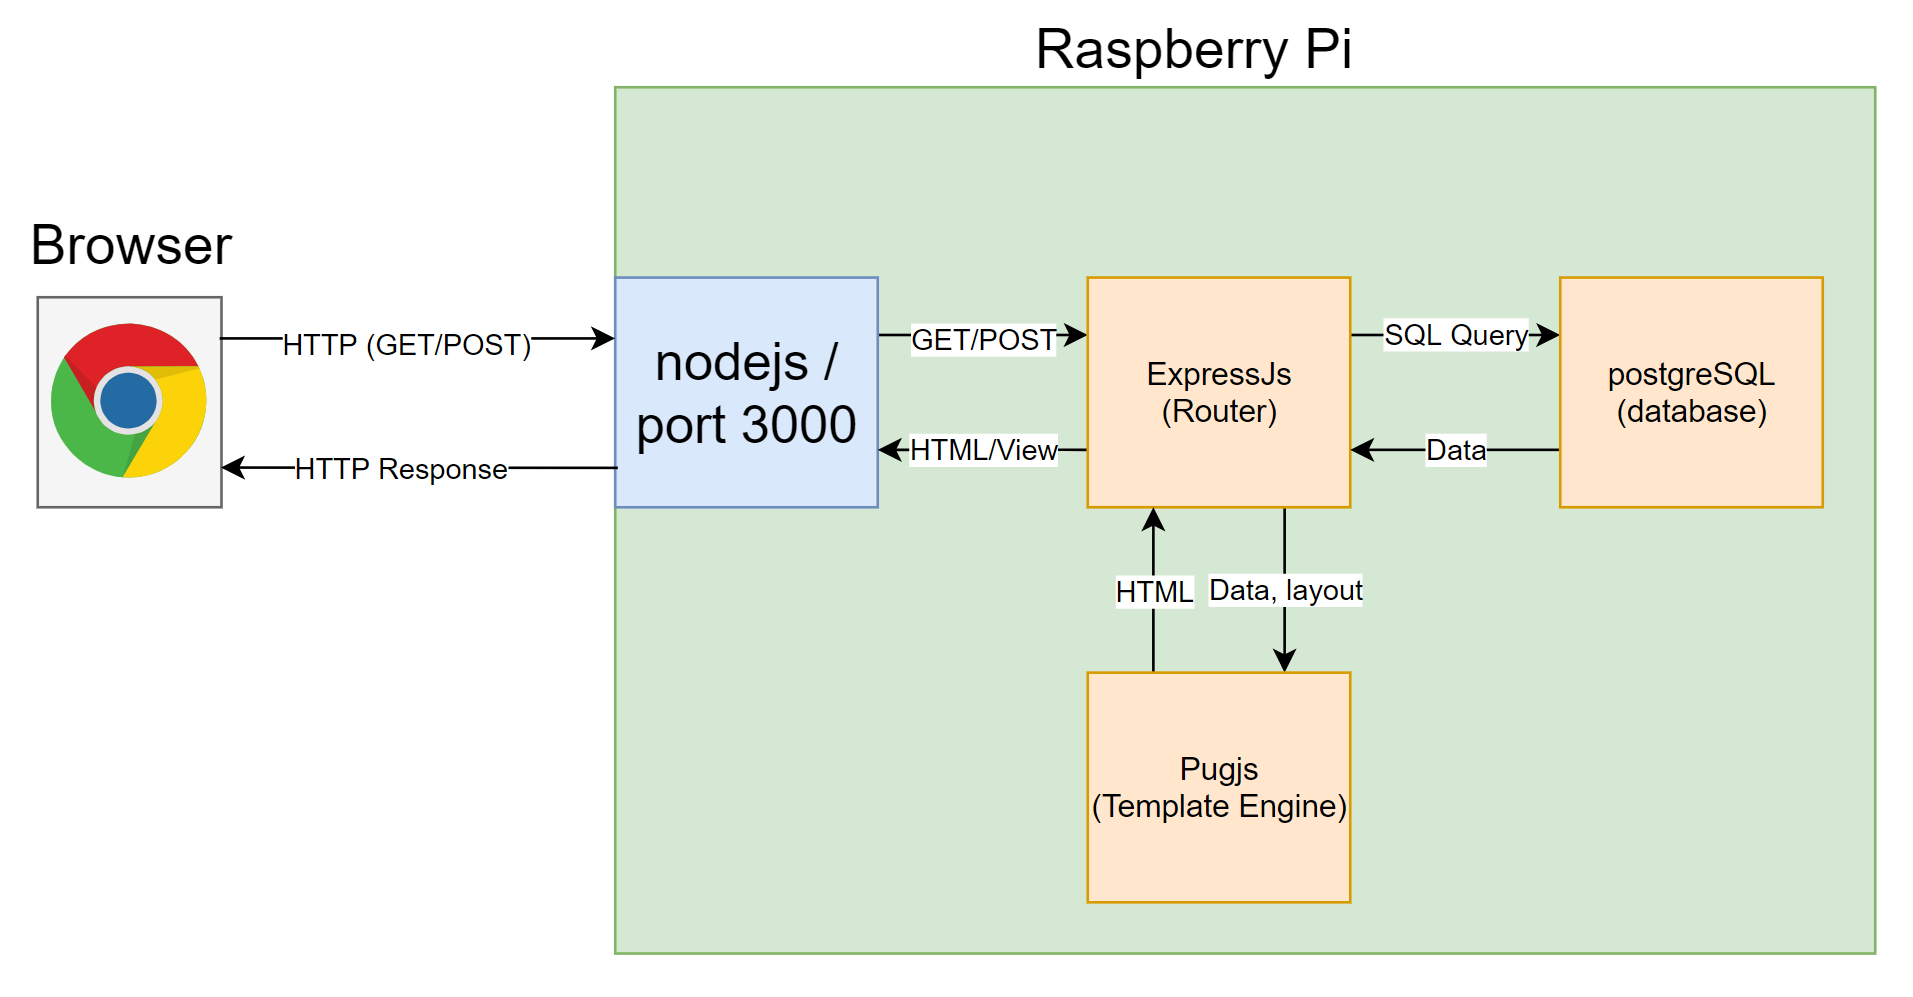
For our second attempt we chose to use a combination of frameworks and services. To start with, we chose to use nodejs as our back-end javascript environment along with express-js for our web application framework, and pugjs as a template engine. Figure 12 shows a system overview of our website. To begin with, we created a basic website which featured a simple home page.
As shown in figure 12, this works by having expressjs handle any HTTP get and HTTP post requests. In this case, when visiting the home page, the router.get("/") callback is run, and the render function is used to "render" the desired view (in index.js of the express section of the appendix). To get expressjs to properly render the pug template, we configured express to use pug in the app.js file which can be found in the appendix.
We chose to make use of a template engine like pugjs as it allowed us to easily expand the basic layout to suit the specific needs of each page. The templates for each page (layout.pug, water.pug, index.pug, and home.pug) can be found in the website/views directory of the github repository. With this basic website setup and functioning, we then moved on to adding the desired functionality.
Before building up the website further, we first experimented with connecting to the database using server-side javascript. To accomplish this we made use of the node-postgres library and created a file index.js in a db folder. In this file we did something similar to config.py and connect.py, where we handle creating a pool and exporting a query function. By doing
this we could avoid having to repeat this setup in every file we intend to use the database in, and instead can simply "require" the db file and make use of db.query. We then used this function to test querying the database when attempting to load the home page of the website. Once we confirmed that we could in-fact query the database, we then moved on to adding additional
pages to the website.
The first page we chose to add was the water quality page. Here we wanted to display graphs of the ppm data and pH data over time along with the raw data collected from each sensor. To create the graphs we made use of the Chartjs library combined with a bit of javascript which can be found in the water.pug file and waterChart.js file.
We used javascript to parse through the data received from querying the database and then passed this data to the waterChart.js script. This was the easiest method we found of passing data from the database to client-side javacsript. With the graphs created, we then used pug to display all of the data collected in the form of a table.
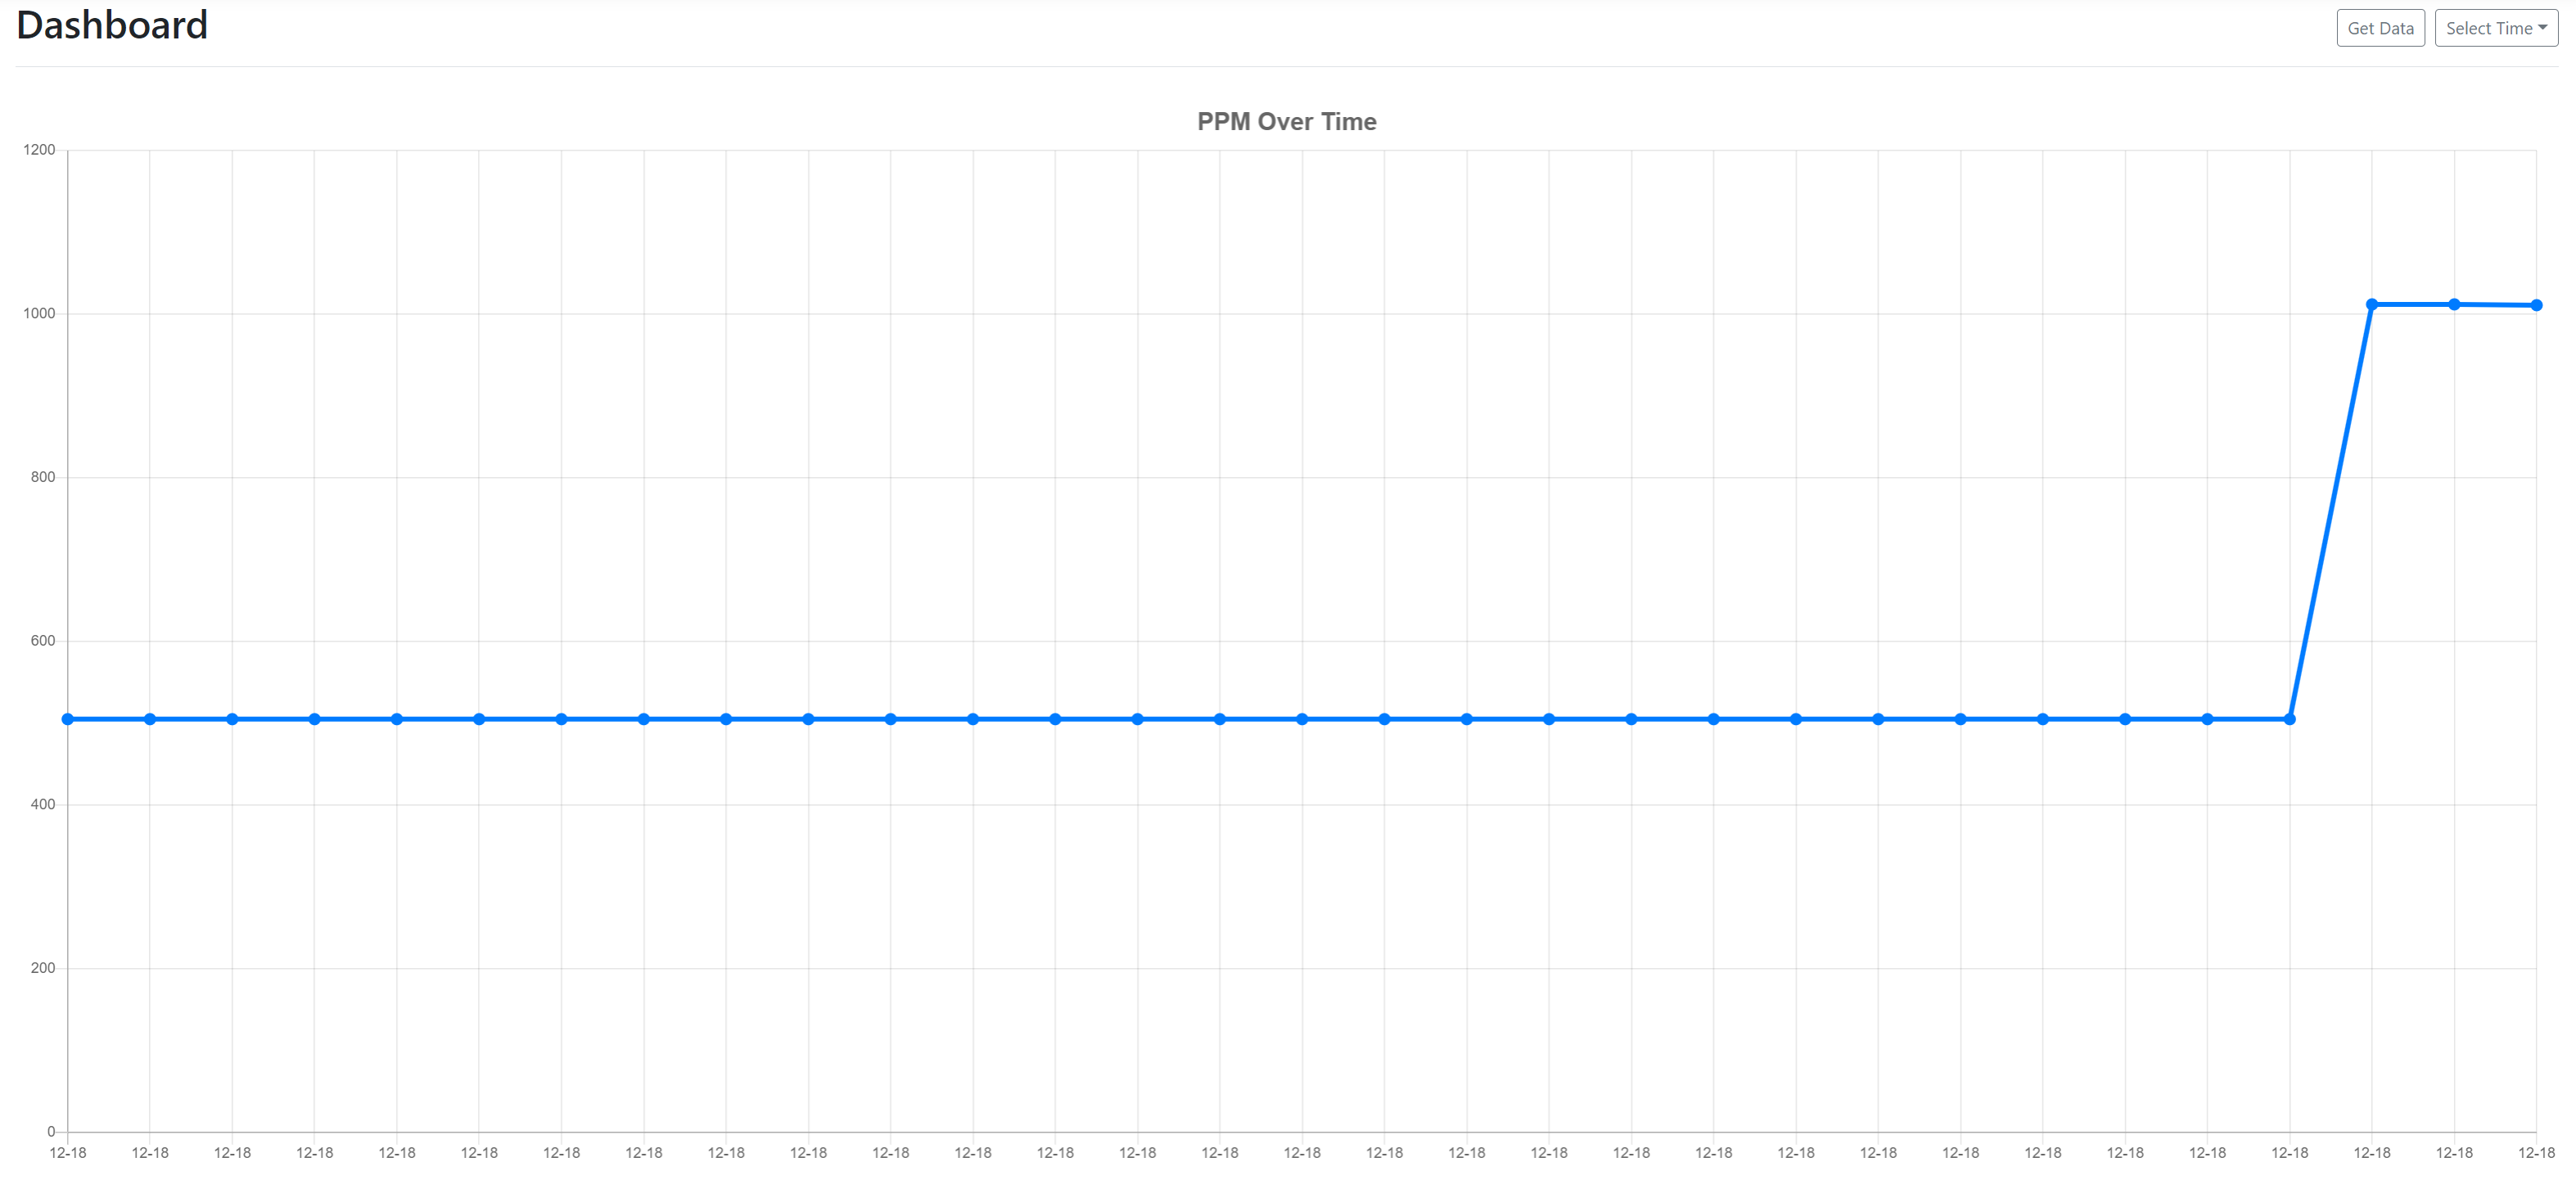
As we are collecting data every half hour, we decided we also wanted to provide the ability to only display data for the current day, week, month, etc. To do this, we made use of html forms, which trigger an HTTP "Post" message upon submission. This post is received as a separate callback in the expressjs code, and we then use the data submitted through the form to query the database in the desired way. Figure 13 shows
an image of what the water quality page looks like. Furthermore, as we wanted to provide a mechanism of getting new data quickly (to use when adding nutrients or pH balancer), we also added a button which manually triggers the data collection script. We had some unexpected difficulties getting this button to function at first, mainly that the python script didn't seem to be running. This issue was eventually solved when we realized that when running the python script
from javascript, a connection to the database was not being formed correctly. This ultimately turned out to be an issue with file paths, and after converting to absolute file paths, everything worked as expected.
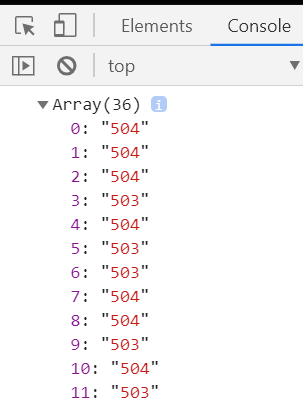
Similar methods were used for the plant dash_board page which displays graphs of plant height over time and also provides a dropdown to select between which plant you would like to see the data for. To actually test these two pages we made use of the console.log function which allowed us to print results to both the Raspberry Pi as well as the chrome browser we were using for testing. This was extremely helpful especially when trying to
see why data was not being displayed correctly on the client-side. Chromes built-in console allowed us to view the data being processed by the client-side script, which allowed for a much simpler debugging experience. An example of this can be seen in figure 14 which shows a snippet of the array sent to the waterChart.js script.
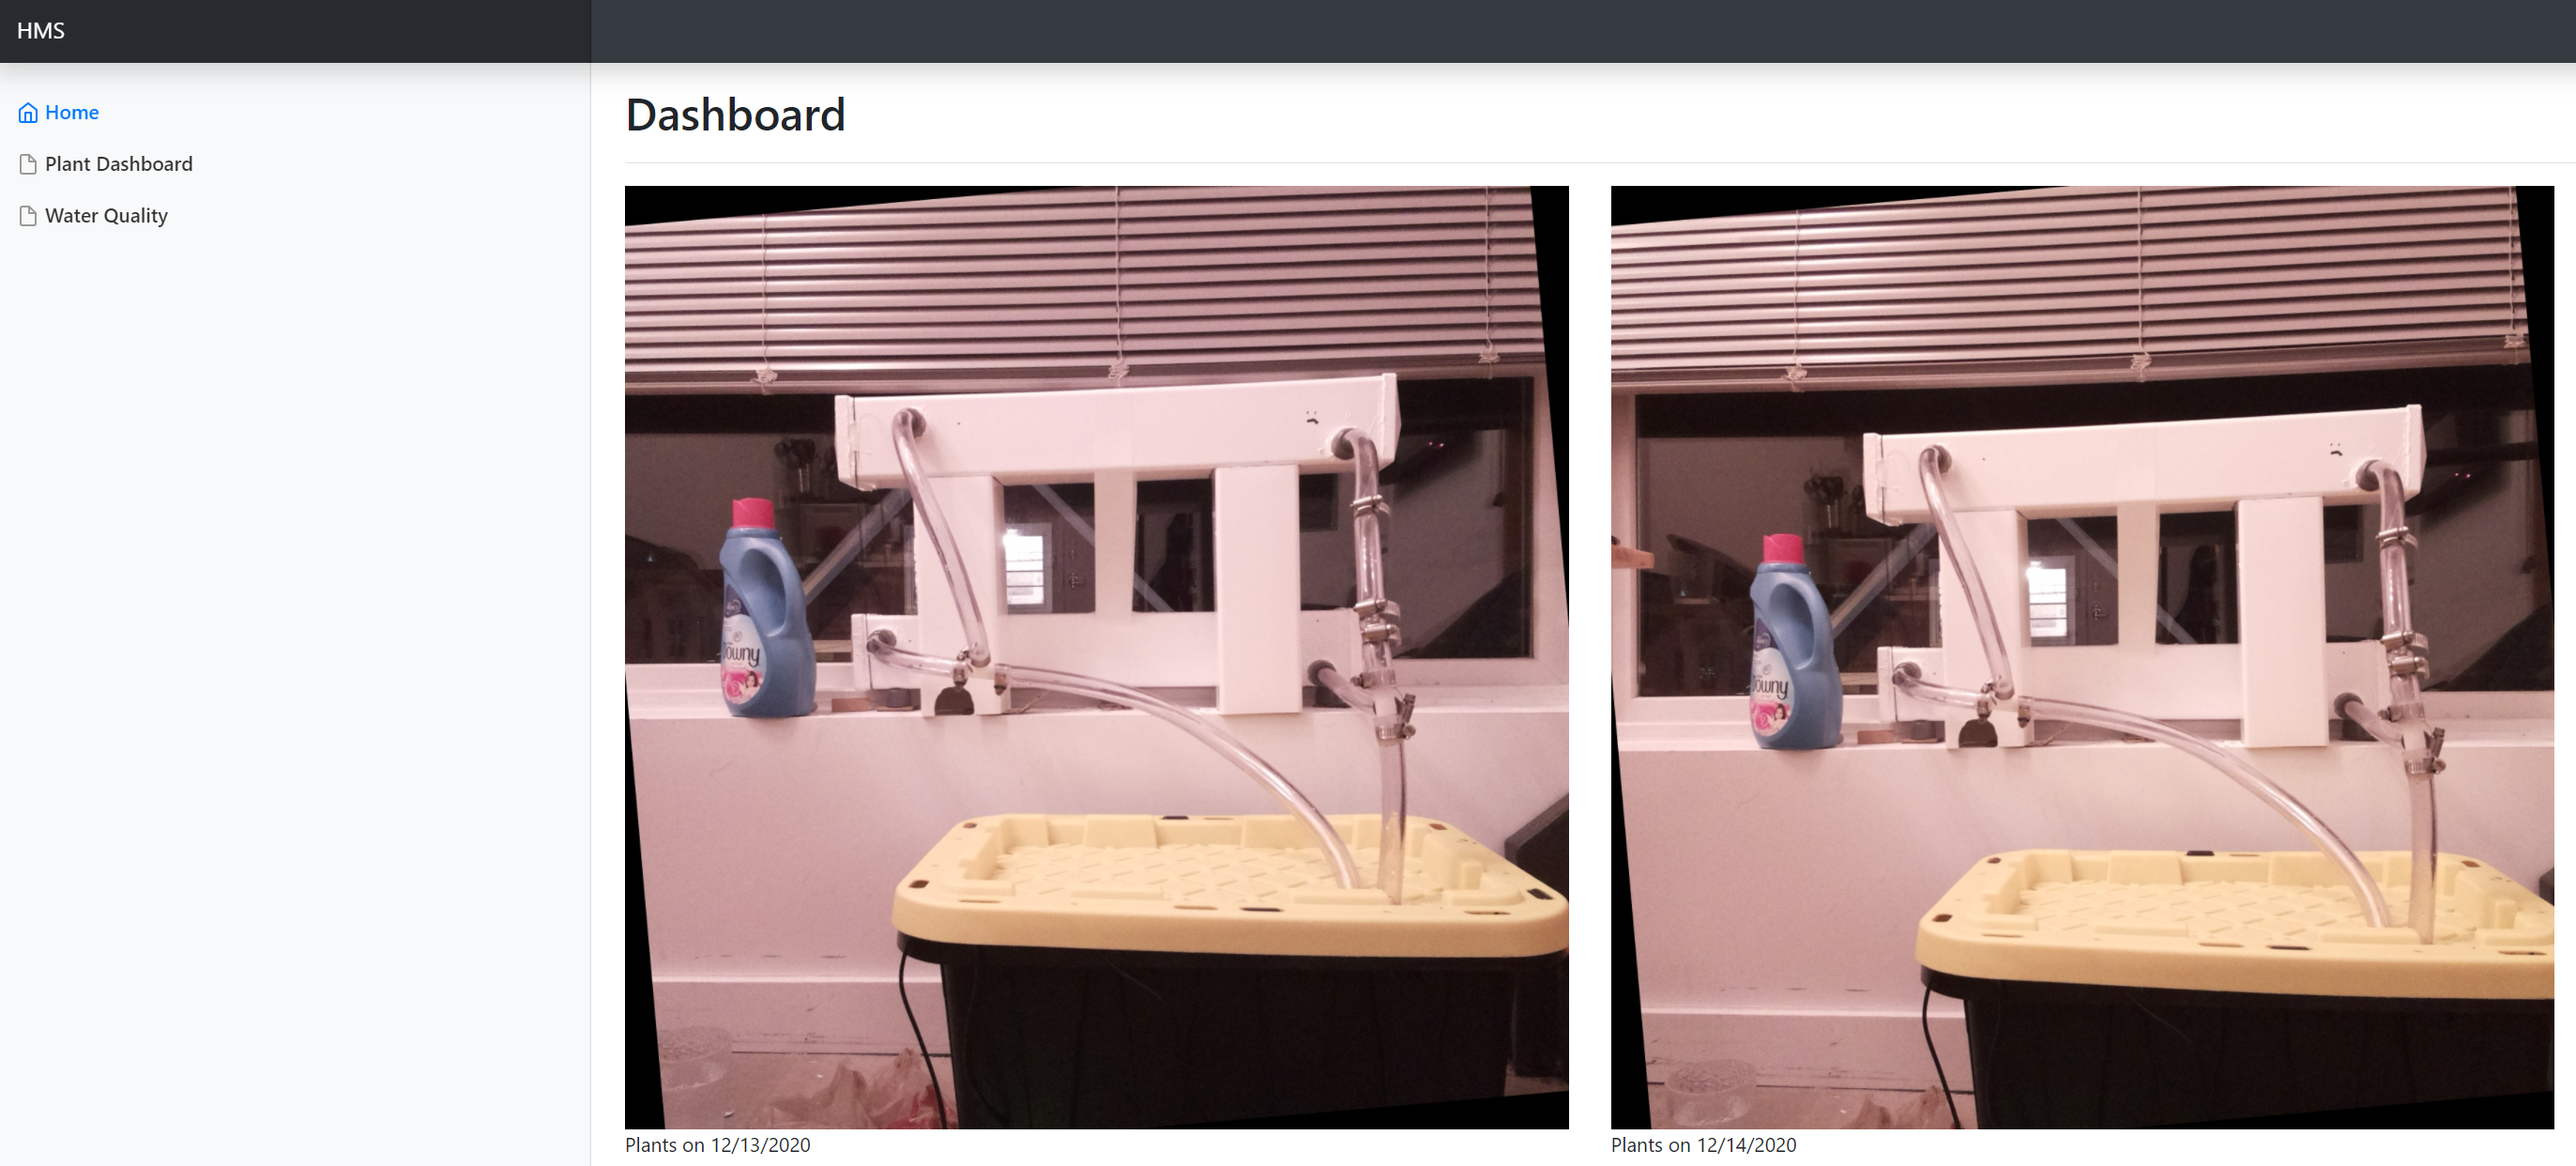
The final aspect of the website was creating a page to display images of the plants. To do this, we used pugjs to create an "image gallery" based on the date. At 9pm each night, a new image of the plants is taken which is then stored in the images folder of the website. This image is specifically labeled using the month-day-year format so it was easier for us to loop through the number of pictures currently in the folder. The file used (home.pug) can be found in the appendix and an image of the page can be seen in figure 15.
Results

Overall our group managed to achieve the goals we had set for this project. For our demo, we managed to create a fully functioning hydroponics system equipped with a camera for monitoring plant height, sensors for monitoring ppm and pH values, and a website which allows a user to view the current plant growth and data. For the most part, everything performed as planned in the end, although there were some hiccups along the way. One issue we were not able to fix was an odd fluctuation in the values our pH sensor was recording which can be seen in figure 16. We did directly measure the analog output voltage to ensure that the readings weren't caused by impedance issues with the ADC, and our results seemed to agree with the fluctuations we were seeing after the analog to digital conversion. As such, we we are still unsure if we just received a fault sensor or if there was something else we needed to do in order to ensure proper stability. Unfortunately, the component we purchased has poor/non-existent documentation so debugging this problem poses a significant challenge. Additionally, we were unable to actually achieve proper plant growth in time for the demo. As we built the system too late, the seedlings did not have enough time to grow large enough, and so we had to use other objects in order to test our openCV solution. We are fairly confident that had the plants grown large enough we would have been able to determine their heights however. Outside of these issues, everything performed as expected in the end and we are happy with our results.
Conclusion
In the end, our project features a hydroponics system capable of supporting up to 8 plants. To support these plants the project contains two sensors, a ppm sensor and pH sensor, which are used to monitor the state of the hydroponics environment. These sensors allow a user to know
when the nutrient levels in the water or the pH levels of the water have fallen out of the acceptable range for the current plants. Additionally, the system makes use of a pump controlled by a relay which allows for the eb and flow method of irrigation to be used. This allows us to prevent over
watering of the plants. Finally, a camera attached to the Raspberry Pi is used along with openCV to track the height of each plant. These systems combined with a postgreSQL database and website allow for a user to remotely monitor the growth of their plants.
Of course, during this project we found that not everything went as expected. One thing we discovered that definitely did not work was attempting to manually widen circular holes. As mentioned previously, this resulted in a number of leaks due to poor seals, which we then had to
use silicon caulk to fix. This problem could most likely be fixed by using a properly sized drill or by using a system built from circular PVC. Another issue we encountered along the way was rigid tubing. The tubing we used for water flow was far to rigid, and resulted in some balancing
issues as without water in the posts to act as a weight, the entire structure was slowly being pulled off the wall. This issue could easily be remedied by using slightly less rigid tubing, which would have also allowed for a more balanced water flow between the two hydroponics bays as mentioned
earlier. Finally, probably one of our biggest issues was figuring out how to build a website with server-side javascript. Originally we attempted to use Jekyll to build a static website, but we quickly found out that there was no easy way to connect to the database or start local python scripts due to the fact
that only client-side javascript was being used in that case. Restructuring our website to make use of frameworks such as nodejs and expressjs helped to solve these issues.
Future Work
If we had more time to work on this project there are a number of things that we would have liked to explore. For starters, assuming a larger budget, we would have liked to add some sort of moisture sensor to the netcups housing each plant. The idea here would be that
rather than using a simple 10-hour timer to control the relay, we could instead use the moisture level of the wool in each cup. When it is detected that the wool is completely dry, then the pump cycle would be triggered. This would allow us to potentially create a more automated
system. Going along with this concept, we would have also liked to add a way to automatically add pH balancer and nutrients to the water. The idea here would be that the system would automatically check to see if the pH levels and ppm levels are within the desired range set by the user.
If not, an automatic dispenser would slowly add the needed solution to the water, dispensing a little at a time and then reading the sensor data to see if the levels are now within the acceptable range. These additions would allow for the system to be much more automated, and potentially allow
for plant growth without any input from a user.
On the website side there are a number of things we would have liked to do as well. For starters, the website is currently only setup to allow for one set of plants in one location. With more time, we believe it would have been interesting to create a modular system of sorts. The idea is that
the website would provide a page where one could "create" a new system. When creating a new system, every sensor and camera not in use by another system would be displayed along with their associated GPIO port(s). Using this method, a user could easily connect a new series of sensors and a camera
and then press go. The website would then take care of creating the new database tables and generating the scripts used to insert data from those sensors into the new tables. The website would then also present the option to choose which location to inspect.
Work Distribution

Cameron Haire
cdh99@cornell.edu
- Designed hydroponics structure
- Built hydroponics structure
- Wrote openCV scripts for measuring plant-height
- Wrote scripts for collecting sensor data

Anthony Viego
amv64@cornell.edu
- Setup and tested the postgreSQL database
- Designed and developed the website
- Assisted in building the hydroponics structure
- Wrote scripts for collecting sensor data
Parts List
- PVC Post - $22.68
- PVC Cap (x4) - $11.06
- Reservoir - $17.97
- Net Cup - $9.99
- TDS Sensor - $11.90
- pH Sensor - $15.90
- Relay - $1.49
Total: $90.99
References
PiCamera DocumentPostgreSQL Setup
Node-postgres
Expressjs
Pugjs
ADC guide and setup
Nodejs
Bootstrap
R-Pi GPIO Document
Code Appendix
Github LinkAll of our code for this project can be found in the repository linked above. The scripts mentioned in the design and testing section of this report can be found in below
Sensor and Data Collection
#names: Anthony Viego, Cameron Haire
#netIDs: amv64, cdh99
#Date: 12/18/2020
#adc.py

#adc reading and conversion script
#modified from adafruit template

import os
import time
import busio
import digitalio
import board
import adafruit_mcp3xxx.mcp3008 as MCP
from adafruit_mcp3xxx.analog_in import AnalogIn

def remap_range(value, left_min, left_max, right_min, right_max):
    # this remaps a value from original (left) range to new (right) range
    # Figure out how 'wide' each range is
    left_span = left_max - left_min
    right_span = right_max - right_min
    # Convert the left range into a 0-1 range (int)
    valueScaled = (value - left_min) / int(left_span)

    # Convert the 0-1 range into a value in the right range.
    return round((right_min + (valueScaled * right_span)), 1)

def adc():
    # create the spi bus
    spi = busio.SPI(clock=board.SCK, MISO=board.MISO, MOSI=board.MOSI)

    # create the cs (chip select)
    cs = digitalio.DigitalInOut(board.D22)

    # create the mcp object
    mcp = MCP.MCP3008(spi, cs)

    # create an analog input channel on pin 0
    chan0 = AnalogIn(mcp, MCP.P0)
    chan1 = AnalogIn(mcp, MCP.P1)

#    print('Raw ADC Value on pin 1: ', chan0.value)
#    print('ADC Voltage on pin 1: ' + str(chan0.voltage) + 'V')

#    print('Raw ADC Value on pin 2: ', chan1.value)
#    print('ADC Voltage on pin 2: ' + str(chan1.voltage) + 'V')

    # read the analog pin
    trim_pot = chan0.value >> 6
    trim_pot2 = (chan1.value >> 6)

    # convert 16bit adc0 (0-65535) trim pot read into 0-100 volume level
    set_ppm = remap_range(trim_pot, 0, 750, 0, 1000)
    set_ph = remap_range(trim_pot2, 0, 1023, 14, 4)

    return(set_ppm, set_ph)
#names: Anthony Viego, Cameron Haire
  #netIDs: amv64, cdh99
  #Date: 12/18/2020
  #config.py

  #retrieves database login parameters

  from configparser import ConfigParser


  def config(filename='database.ini', section='postgresql'):
      # create a parser
      parser = ConfigParser()
      # read config file
      parser.read(filename)

      # get section, default to postgresql
      db = {}
      if parser.has_section(section):
          params = parser.items(section)
          for param in params:
              db[param[0]] = param[1]
      else:
          raise Exception('Section {0} not found in the {1} file'.format(section, filename))
      return db
#names: Anthony Viego, Cameron Haire
#netIDs: amv64, cdh99
#Date: 12/18/2020
#connect.py

#forms a connection to the postgreSQL database and forwards it
#to data_collect.py

import psycopg2
import time
from config import config

def connect():
    """ Connect to the PostgreSQL database server """
    conn = None
    try:
        params = config()
        conn = psycopg2.connect(**params)
        return conn
    except (Exception, psycopg2.DatabaseError) as error:
        print(error)
#names: Anthony Viego, Cameron Haire
  #netIDs: amv64, cdh99
  #Date: 12/18/2020
  #data_collect.py

  #retrieves data from sensors and inserts it into the database

  import time
  from connect import connect
  from adc import adc

  while True:
      conn = connect()
      values = adc()
      #store values from ADC into variables
      ppm = values[0]
      ph = values[1]
      #get the local time struct (year, month, day, hour, minute, second)
      curr_time = time.localtime()
      curr = conn.cursor()
      #issue a INSERT query to the database
      curr.execute("INSERT INTO water_condition VALUES(%s, %s, %s, %s, %s, %s, %s, %s);", (ph, ppm, curr_time[0], curr_time[1], curr_time[2], curr_time[3], curr_time[4], curr_time[5]))
      #commit the insert to the database
      conn.commit()
      conn.close()
      time.sleep(1800)
Plant Height and Relay Scripts
#names: Anthony Viego, Cameron Haire
#netIDs: amv64, cdh99
#Date: 12/18/2020
#timed_water.py

#Runs the pump every 10 hours using a pre-defined cycle

import RPi.GPIO as GPIO
import time
import signal
import sys

GPIO.setmode(GPIO.BCM)
GPIO.setup(19, GPIO.OUT)

#signal handler allows for CTRL-C to be used to disable the pump in the event of an
#emergency such as a leak
def signal_handler(sig, frame):
    GPIO.output(19,0)
    GPIO.cleanup()
    sys.exit(0)

#runs once every 10 hours, does one 10.5 second burst, followed by 6, 4 second bursts
while True:
  signal.signal(signal.SIGINT, signal_handler)
  GPIO.output(19, 1)
  time.sleep(10.5)
  GPIO.output(19, 0)
  time.sleep(7)
  count = 0
  while count < 6:
      GPIO.output(19,1)
      time.sleep(4)
      GPIO.output(19,0)
      time.sleep(7)
      count = count + 1
  time.sleep(36000)
GPIO.cleanup()
#names: Anthony Viego, Cameron Haire
  #netIDs: amv64, cdh99
  #Date: 12/18/2020
  #plant_collect.py

  #Schedules a job to run every day at 9pm
  #The job calls the plant_height script and then inserts the data into
  #the database

  import time
  from connect import connect
  from plant_height import calcHeight

  import schedule

  def job(t):
      #forms a connection to the database
      conn = connect()
      #gets the plant height array
      plants = calcHeight()
      #gets the localtime struct
      curr_time = time.localtime()
      curr = conn.cursor()
      #for each plant, inserts the height data into the corresponding table
      for x in range (0, 8):
          curr.execute("INSERT INTO plant_" + str(x) + " VALUES(%s,  %s, %s, %s, %s, %s, %s);", (plants[x], curr_time[0], curr_time[1], curr_time[2], curr_time[3], curr_time[4], curr_time[5]))
          conn.commit()
      conn.close()
      return

  schedule.every().day.at("21:00").do(job,'It is 21:00')

  while True:
      schedule.run_pending()
      time.sleep(60) # wait one minute
Website Code and Scripts
//names: Anthony Viego, Cameron Haire
  //netIDs: amv64, cdh99
  //Date: 12/18/2020
  //app.js

  //defines folders and engines necessary for the website,
  //routes for the expressjs router, views for the renderer

  const express = require('express');
  const path = require('path');
  const routes = require('./routes/index');
  const bodyParser = require('body-parser');

  const app = express();


  app.use(express.static('public'));
  app.set('views', path.join(__dirname, 'views'));
  app.set('view engine', 'pug'); //sets the view engine to pugjs

  app.use(bodyParser.urlencoded({ extended: true }));
  app.use('/', routes);

  module.exports = app;
//names: Anthony Viego, Cameron Haire
  //netIDs: amv64, cdh99
  //Date: 12/18/2020
  //index.js (/routes)

  //handles HTTP get and HTTP post messages and performs actions based
  //on the request. Actiosn include database lookups, view rendering, etc

  const express = require('express');
  const { check, validationResult } = require('express-validator');
  const db = require('../db')
  const router = express.Router();

  //router.get methods, one exists for each potential page on the site
  router.get('/', (req, res) => {
    //use pug to render the home.pug file
    //this gets converted to HTML by pug
    res.render('home', {title: 'HMS Home'});
  });
  router.get('/water', (req, res) => {
    var registrations;
    //pull all data from the water_condition table
    db.query("SELECT * FROM water_condition", [], (err, results) => {
      if (err){
        console.log(err);
        res.send('Sorry! Something went wrong.');
      }
      else{
        console.log("got the water data");
        //store the results of the query into a variable
        registrations = results.rows
        //render water.pug and send pass the data to PUG in the registrations variable
        res.render('water', {title: 'HMS Water Quality', registrations});
      }
    })
  });
  //use regex to get any HTTP GET message with plant_ followed by anything
  router.get('/plants_*', (req, res) => {
    console.log(req.url);
    //get the URL in the request
    var plant_num = req.url;
    //grab the desired number from the url
    var thenum = plant_num.replace( /^\D+/g, ''); // replace all leading non-digits with nothing
    var tb = "plant_" + thenum;
    console.log(tb)
    var registrations;
    var row_length;
    //query the desired plant table
    db.query("SELECT * FROM " + tb, [], (err, results) => {
      if (err){
        console.log(err);
        res.send('Sorry! Something went wrong.');
      }
      else{
        console.log("got the plant data");
        registrations = results.rows
        console.log(registrations[0].height)
        row_length = results.rows.length
        //query the users table to get the number of plants in teh system
        db.query("SELECT * FROM users", [], (err, results2) => {
          if (err){
            console.log(err);
            res.send('Sorry! Something went wrong.');
          }
          else{
            console.log("got the stuff");
            var plants = results2.rows[0]
            console.log(registrations)
            //render the index page and forward data queries the pug
            res.render('index', { title: 'Plant Information', registrations, row_length, plants, plant_num });
          }
         console.log(results.rows[0]);
        })
      }
      console.log(results.rows.length);
    })
  });
  //handle HTTP POST messages (form submissions for example)
  router.post('/plants_*', (req, res) => {
    var results = req.body.Calendar;
    var plant_num = req.url;
    var thenum = plant_num.replace( /^\D+/g, ''); // replace all leading non-digits with nothing
    var tb = "plant_" + thenum;
    console.log(tb)
    var registrations;
    var row_length;
    var d = new Date();
    var n = d.getDate();
    var m = d.getMonth() + 1;
    var l = n - 7;
    if (n-7 < 1){
      l = 1;
    }
    if (results == "Day"){
      db.query("SELECT * FROM " + tb + " WHERE month = " + m + " AND day = " + n, [], (err, results) => {
        if (err){
          console.log(err);
          res.send('Sorry! Something went wrong.');
        }
        else{
          registrations = results.rows
          row_length = results.rows.length
          db.query("SELECT * FROM users", [], (err, results2) => {
            if (err){
              console.log(err);
              res.send('Sorry! Something went wrong.');
            }
            else{
              console.log("got the stuff");
              var plants = results2.rows[0]
              res.render('index', { title: 'Plant Information', registrations, row_length, plants, plant_num });
            }
          })
        }
      })
    }
    if (results == "Month"){
      db.query("SELECT * FROM " + tb + " WHERE month = " + m, [], (err, results) => {
        if (err){
          console.log(err);
          res.send('Sorry! Something went wrong.');
        }
        else{
          registrations = results.rows
          row_length = results.rows.length
          db.query("SELECT * FROM users", [], (err, results2) => {
            if (err){
              console.log(err);
              res.send('Sorry! Something went wrong.');
            }
            else{
              console.log("got the stuff");
              var plants = results2.rows[0]
              res.render('index', { title: 'Plant Information', registrations, row_length, plants, plant_num });
            }
          })
        }
      })
    }
    if (results == "Week"){
      db.query("SELECT * FROM " + tb + " WHERE month = " + m + " AND day BETWEEN  " + l + "AND " + n, [], (err, results) => {
        if (err){
          console.log(err);
          res.send('Sorry! Something went wrong.');
        }
        else{
          registrations = results.rows
          row_length = results.rows.length
          db.query("SELECT * FROM users", [], (err, results2) => {
            if (err){
              console.log(err);
              res.send('Sorry! Something went wrong.');
            }
            else{
              console.log("got the stuff");
              var plants = results2.rows[0]
              res.render('index', { title: 'Plant Information', registrations, row_length, plants, plant_num });
            }
          })
        }
      })
    }
    if (results == "All"){
      db.query("SELECT * FROM " + tb, [], (err, results) => {
        if (err){
          console.log(err);
          res.send('Sorry! Something went wrong.');
        }
        else{
          registrations = results.rows
          row_length = results.rows.length
          db.query("SELECT * FROM users", [], (err, results2) => {
            if (err){
              console.log(err);
              res.send('Sorry! Something went wrong.');
            }
            else{
              console.log("got the stuff");
              var plants = results2.rows[0]
              res.render('index', { title: 'Plant Information', registrations, row_length, plants, plant_num });
            }
          })
        }
      })
    }
  });

  router.post('/',   [
      check('name')
        .isLength({ min: 1 })
        .withMessage('Please enter a name'),
      check('email')
        .isLength({ min: 1 })
        .withMessage('Please enter an email'),
    ],(req, res) => {
    const errors = validationResult(req);

    if (errors.isEmpty()) {
      db.query("INSERT INTO users VALUES($1, $2);", [req.body.name, req.body.email], (err, res2) => {
        if (err){
          console.log(err);
          res.send('Sorry! Something went wrong.');
        }
        else {
          res.send('Thank you for your registration!');
        }
      })
      console.log(req.body);
    } else {
      res.render('form', {
        title: 'Registration form',
        errors: errors.array(),
        data: req.body,
      });
    }
  });
  router.post('/water',(req, res) => {
    const spawn = require("child_process").spawn;
    const pythonProcess = spawn('python3',["/home/pi/demo-node-app/public/py/data_collect_once.py"]);
    pythonProcess.stdout.on('data', (data) => {
      console.log(`data:${data}`);
   });
    pythonProcess.stderr.on('data', (data) => {
      console.log(`error:${data}`);
   });
   pythonProcess.stderr.on('close', () => {
    var registrations;
    db.query("SELECT * FROM water_condition", [], (err, results) => {
      if (err){
        console.log(err);
        res.send('Sorry! Something went wrong.');
      }
      else{
        console.log("got the water data");
        registrations = results.rows
        res.render('water', {title: 'HMS Water Quality', registrations});
      }
    })
  });
  });

  router.post('/water_graphs',(req, res) => {
    var results = req.body;
    var d = new Date();
    var n = d.getDate();
    var m = d.getMonth() + 1;
    var l = n - 7;
    if (n-7 < 1){
      l = 1;
    }
    var registrations;
    if (results.Calendar == "Day"){
      db.query("SELECT * FROM water_condition WHERE day = " + n + " AND month = " + m, [], (err, results) => {
        if (err){
          console.log(err);
          res.send('Sorry! Something went wrong.');
        }
        else{
          console.log("got the water data");
          registrations = results.rows
          res.render('water', {title: 'HMS Water Quality', registrations});
        }
      })
    }
    if (results.Calendar == "Month"){
      db.query("SELECT * FROM water_condition WHERE month = " + m, [], (err, results) => {
        if (err){
          console.log(err);
          res.send('Sorry! Something went wrong.');
        }
        else{
          console.log("got the water data");
          registrations = results.rows
          res.render('water', {title: 'HMS Water Quality', registrations});
        }
      })
    }
    if (results.Calendar == "Week"){
      db.query("SELECT * FROM water_condition WHERE month = " + m + " AND day BETWEEN  " + l + "AND " + n, [], (err, results) => {
        if (err){
          console.log(err);
          res.send('Sorry! Something went wrong.');
        }
        else{
          console.log("got the water data");
          registrations = results.rows
          res.render('water', {title: 'HMS Water Quality', registrations});
        }
      })
    }
    if (results.Calendar == "All"){
      db.query("SELECT * FROM water_condition", [], (err, results) => {
        if (err){
          console.log(err);
          res.send('Sorry! Something went wrong.');
        }
        else{
          console.log("got the water data");
          registrations = results.rows
          res.render('water', {title: 'HMS Water Quality', registrations});
        }
      })
    }

  });

  module.exports = router;