ECE 5725 Final Project:
Space Object Tracker
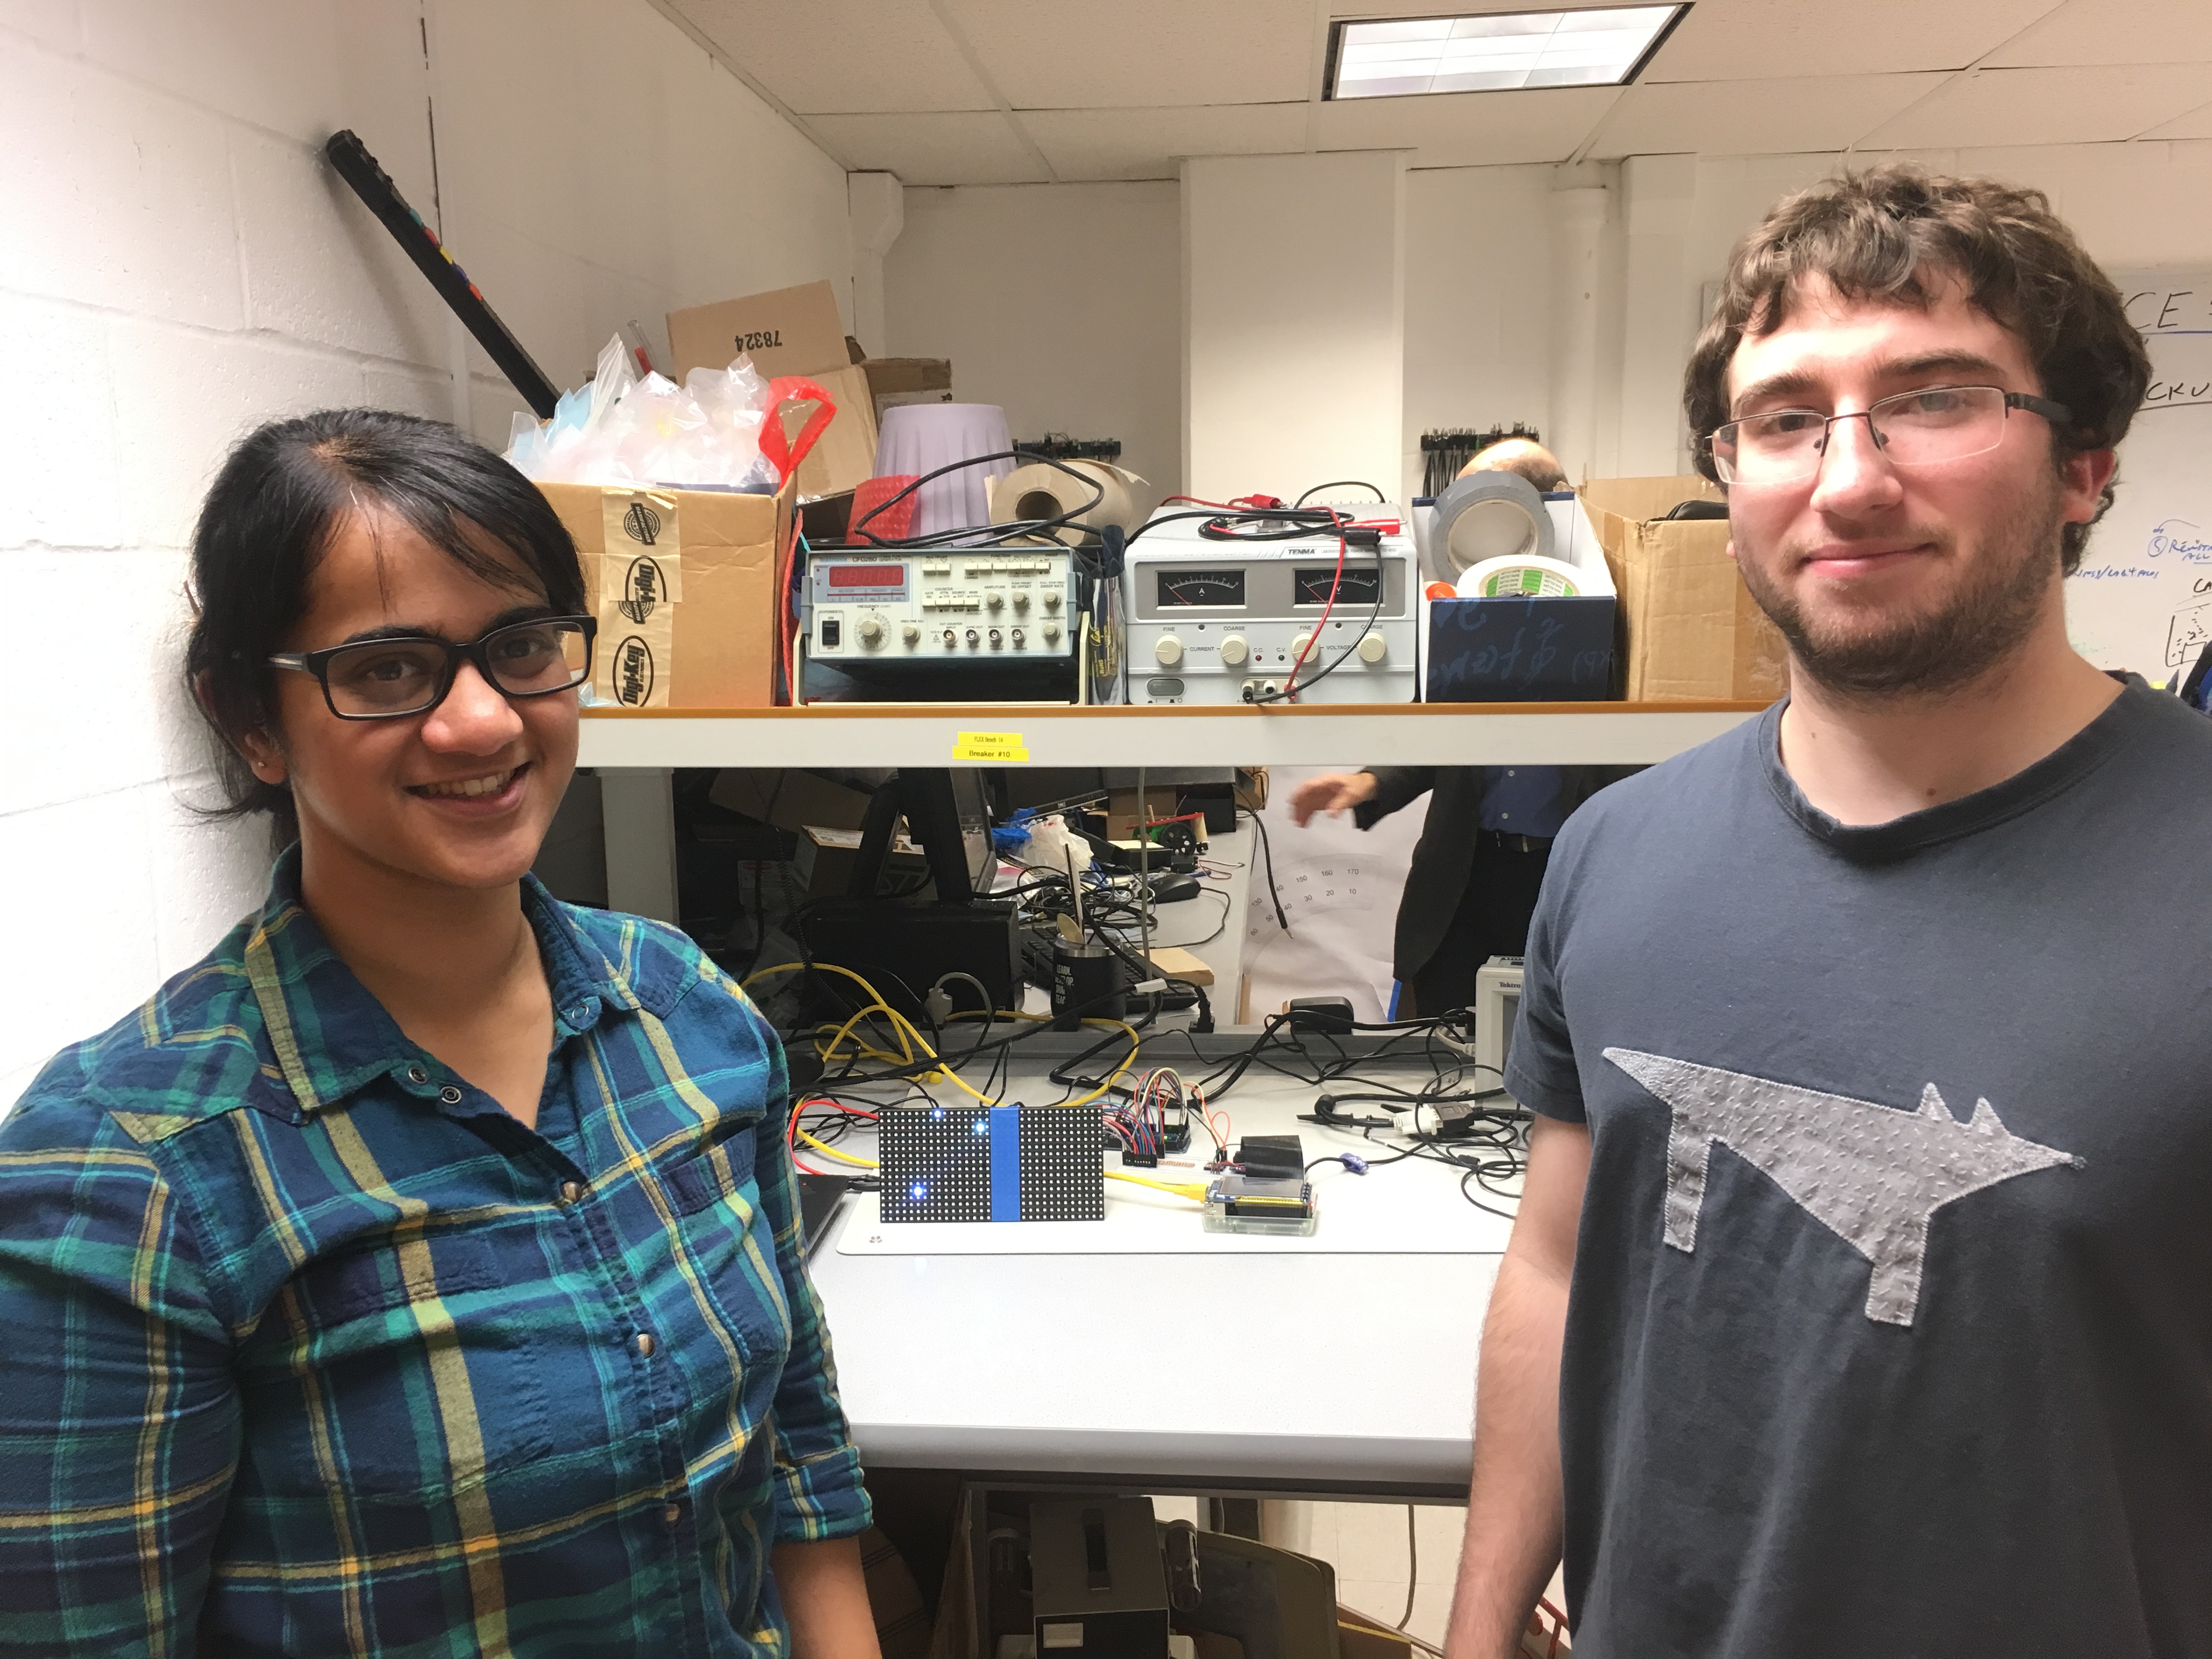
Pavel Berezovsky (pvb23) and Haritha Muralidharan (hm535)
Objective
The design objective of this project is to build a system that is capable of tracking active satellites and displaying information about them in a user-friendly and user-interactive way. The learning objectives were to implement multi-processing in a constrained embedded environment (the Raspberry Pi), and to understand the principles for good user-interface design.
Introduction
For the space junkies or just the curious minded, it is always interesting to know what is flying far above our heads.Unfortunately, city lights or cloudy skies make it almost impossible to spot objects of interest. The goal of this project was to build an interactive display piece that can track and show the movement of space objects in the vicinity. While there are many thousands of objects (including debris and inactive/ malfunctioning satellites - check out this website!) flying around the Earth, we have narrowed the objects of interest to active satellites in Low-Earth Orbit (LEO). In total, about 1200 satellites are being searched for. The information gathered about each satellite includes satellite name, unique ID, year launched, corresponding launch number of that year, longitude, latitude, and altitude.
Our system tracks the satellites flying over the user’s specified location of interest, and displays information about them in two ways:
i) The users will be able to read information about the satellites, such as their names, functions, locations, and other unique data through interaction with the PiTFT.
ii) An LED matrix will display the trajectory of the satellites in real-time. Ideally, the LEDs in the matrix should update every 3-5 seconds based on the movement of the satellites.
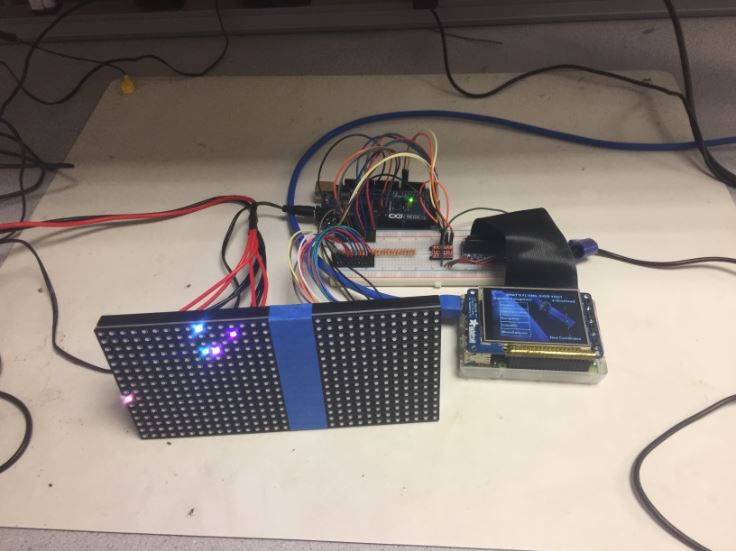
Figure 1 - Our final setup displaying satellites flying over Ithaca, New York. The LED Matrix shows the movement of the satellites, while the PiTFT displays more information about each satellite.
Design & Testing
The design of this system is split into four stages:
Stage 1 - This stage is the 1st out of 4 levels of the menu on the PiTFT that enables the user to input the desired longitude and latitude coordinates.
Stage 2 - This stage is responsible for filtering satellites based on the coordinates provided and to obtain the data about each satellite.
Stage 3 - This stage is the 2nd - 4th level of the menu on the PiTFT that enables the user to visualize how many satellites are overhead and display the information about them based on the results of Stage 2.
Stage 4- This stage is the LED matrix display of the motion of the satellites as they fly around the area of interest.
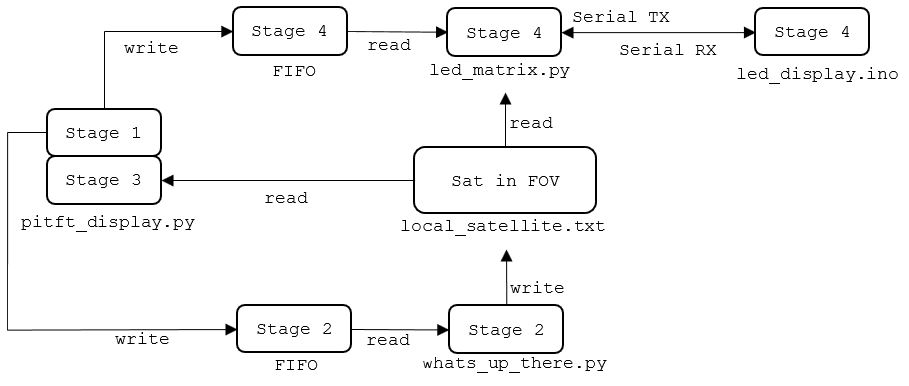
Figure 2 - The high level system design of our satellite tracker.
For comprehensiveness, we have broken down this section into three complementary parts: we will first talk about the design and challenges in implementing a live satellite tracker with the Raspberry Pi (Stage 2); then about the user-interactive PiTFT menus (Stages 1 and 3); and finally the setup of the LED Matrix display (Stage 4).
Satellite Tracking System
Overview
We chose to implement a web-based satellite tracking system. Up-to-date information on the current orbital locations of space objects can be obtained from various websites such as celestrak and space-track (for instance, all the information about weather satellites can be obtained here).
However, the databases are only available as Two-Line Element (TLE) files, whose raw information is not in a human-readable format. As an example, this is the raw information provied for the NOAA 15 weather satellite:
NOAA 15
1 25338U 98030A   18307.55349482  .00000031  00000-0  31912-4 0  9994
2 25338  98.7640 324.0426 0010529 177.1300 182.9942 14.25881624 64886
Code Block 1 - An example satellite entry in the TLE format.
The PyOrbital library provides functions to parse useful information from the TLE files. For example, to obtain the current information (specifically, the latitude, longitude, and altitude) of the NOAA 15 satellite, the command would be:
orb = Orbital('noaa 15')
now = datetime.utcnow()
orb.get_lonlatalt(now)
Code Block 2 - Commands to use PyOrbital functions to get the current position of the NOAA 15 weather satellite.
One of the major limitations of the PyOrbital library is that it can only return information of a known satellite. It is unable to perform the reverse search (i.e. to return a satellite based on a given location). Another major limitation of the library is that it can only handle one satellite at a time; it is unable to return a bundle of information for a “list” of satellites.
For our project, we needed to find all the objects flying over the desired field-of-view (FOV). On the surface of the Earth, the FOV would be a square centered over the user’s desired coordinates.
Algorithm Design
The required output of this stage is a file of satellites flying over the user’s desired FOV. The file should contain information on the satellites’ static (name, unique ID, launch year, launch number, and function/ type) and dynamic information (latitude, longitude, altitude). The static information are fields that do not change with every iteration, and hence can be computed and stored offline. The dynamic information are fields that change with every iteration, and hence have to be actively queried. The information should be updated every 5 seconds.
A straightforward linear search through default function calls to the PyOrbital library takes 120 seconds on the Raspberry Pi, which is far too long for real-time implementation. Therefore, we designed a nested-search multi-processing algorithm to update the satellite information in real time.
Part I: Offline Computation
Prior to online execution, we built a local database of all the satellites’ static information fields. The online program will simply have to reference this local database, reducing the amount of TLE information parsed during online execution, and thus decreasing online execution time. An example entry from the local database that was saved offline is given in Code Block 3.
25338:NOAA 15,ARGOS,1998,030A
Code Block 3 - An example entry of the static satellite information parsed and stored offline. The entry consists of (in order of appearance) the unique id, the name, the function/ type, the launch year and the launch number.
Part II: Error Handling
We noticed that the PyOrbital was not perfect, in the sense that it was not always able to find the information about the specified satellite. There were several reasons for this: Some errors were caused by “deep-space” satellites. This means that due to some malfunction, the satellites had deviated from their orbits, and could no longer be located. Other errors were more library specific, and were more sporadic (e.g. timeouts in the query). These errors caused the program to crash infrequently. To avoid this, we wrapped the queries in a try-except block.
Part III: Nested Search with Multi-Processing
We realized that with a single search implementation (using one core of the Raspberry Pi), the lowest execution time that could be achieved was 50 seconds. Therefore, to achieve real-time updates, we would have to break-down the search into several processes. However, even if we used all four cores of the Raspberry Pi, it would probably only be possible to achieve about a 3x improvement in speed; which means that one complete search would take about 17 seconds, still exceeding our requirements.
In order to solve this, we decided to do a nested search. It is reasonable to assume that satellites will not be able to teleport into the FOV from faraway - i.e. any satellites entering the FOV in the immediate future would be within a certain marginal neighborhood of the FOV. Therefore, to identify the satellites in the FOV, it is sufficient to search the satellites in this neighborhood rather than the full “global” list of satellites. Based on this theory, we devised the following algorithm:
Global Search: A process running on one core will search the full list of satellites to shortlist those in the neighborhood, and hence have a chance of entering the FOV. This full search will take approximately 50 seconds.
Local Search: A process running on a second core will search this shortlist, and further filter out the satellites in the FOV. As fewer satellites are being searched, this process is able to update their dynamic information roughly every 5 seconds, meeting our requirements.
This is illustrated in Figure 3. The Global Search will query all the satellites and filter out the ones in the neighborhood of the FOV. In Figure 3, the grey satellites represent those that will probably not enter the FOV in the immediate future, while the blue satellites represent those in the neighborhood and hence could enter the FOV. The Local Search will query the blue satellites and identify the ones currently in the FOV (represented by the colored satellite).
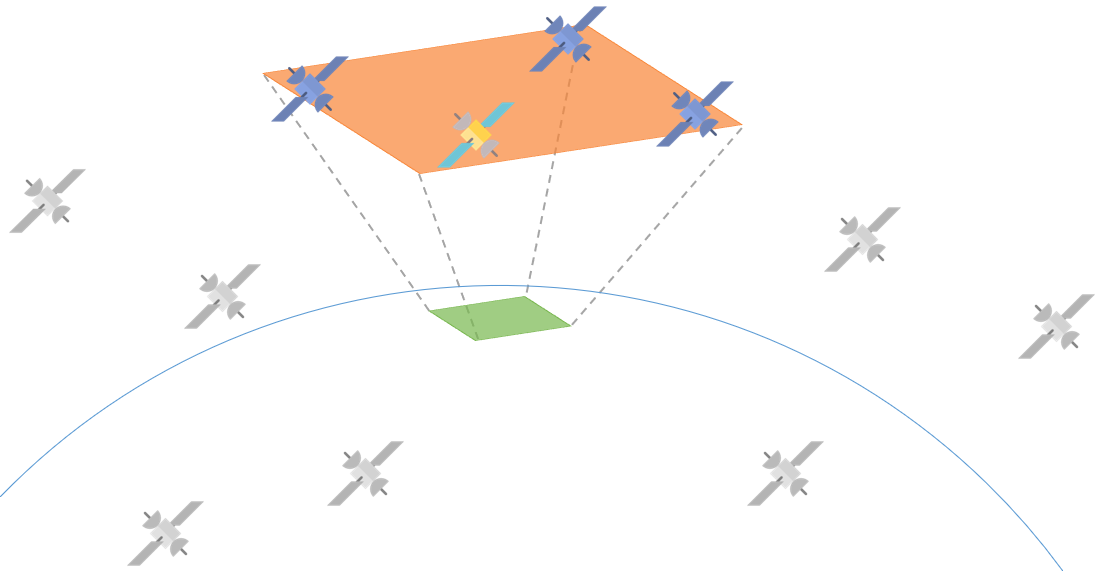
Figure 3 - A visualization of our nested search algorithm.
After some experimentation, we settled on [-5,5] degrees of latitude and longitude for the FOV of interest, and [-20,20] for the Global Search as shown in Figure 4. A Global Search with smaller dimensions would mean that there might be some satellites outside the Global Search field might have time in the 50 seconds to traverse a long distance and enter the Local Search’s FOV, making it inaccurate. However, a Global Search with larger dimensions would result in the Local Search taking more than 5 seconds to complete. We implemented the nested search using the multiprocessing library from Python.
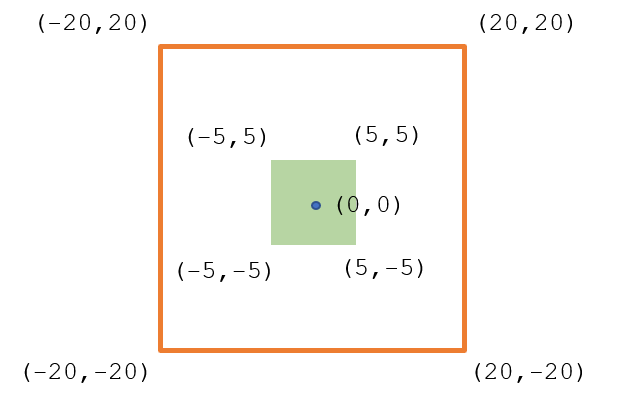
Figure 4 - The search dimensions of Local and Global Searches based around the [0,0] coordinates.
Summary
Overall, our system for satellite search works as follows:
i) The Python program downloads the latest TLE files through subprocess commands.
ii) The Global Search is initialized; it queries all the satellites and filters those within [-20,20] degrees of the center. The output of the Global Search is written to a text file. This program continues indefinitely until the ‘Quit’ signal is received.
iii) Simultaneously, the Local Search is initialized; it queries the output of the satellite from the Global Search and filters those in [-5,5] FOV. Once all the satellites have been filtered, the Local Search process looks up the local text file to obtain the static information associated with the satellites in the FOV. The output of the Local Search (including static and dynamic information) is written to a different text file for the PiTFT display and the LED Matrix. This program also continues indefinitely until the ‘Quit’ signal is received.
User Interactive PiTFT Display
Overview
The PiTFT touchsreen interface is the user interactive aspect of the system. The touchsreen interface is implemented through the use of the PyGame library which enables the display of text and images, as well as detects positions of touch on the screen. Although the Level 1 menu, and the Level 2-to-4 menus are in different stages (Stage 1 and Stage 3 respectively), they are all executed in the same Python file to prevent interference of multiple displays on a single screen. The finite state machine diagram in Figure 5 shows the transitions between Leves 1 to 4.
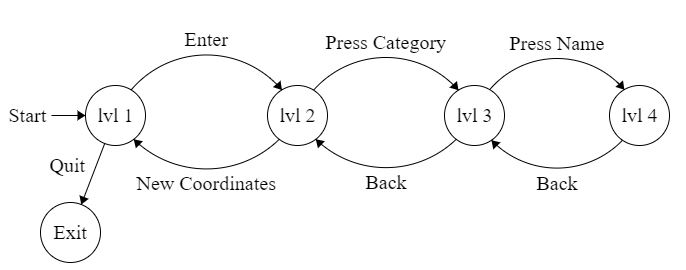
Figure 5 - The transitions between Levels 1 to 4 of the PiTFT menus.
Level 1 Menu (Stage 1)
Level 1 of the menu enables users to enter the longitude and latitude coordinates of any location on Earth. Figure 6a shows the menu at the start of the program. The user has to option to ‘Quit’ the program or enter in coordinates and continue to Level 2. Once the program starts it will not end until the user presses ‘Quit’ on this level. If the user presses ‘Enter’ before typing in coordinates, the system will shift to Level 2 with the default coordinates of Ithaca, NY. To type in new coordinates, the user must first press ‘Longitude’ or ‘Latitude’ to enable the functionality of the ‘0-9’, decimal point, negative sign, and backspace keys. The program has been set up such that if the user enters an invalid coordinate, red exclamation points appear on the screen next to the invalid coordinate, and the ‘Enter’ key will not work until the violating coordinate is corrected. A coordinate is invalid if it exceeds the bounds ( [-180 180] for longitude and [-90 90] for latitude, Figure 6b), or if the entered value is not a float or int (i.e. 0.45-5, 0.99.21,etc., Figure 6c). Once the coordinates are input correctly (Figure 6d), the user presses ‘Enter’, the menu changes to Level 3. It is important to note that upon ‘Quit’ or ‘Enter’, the Quit message or the desired coordinates are sent to Stages 2 & 4 through a FIFO.
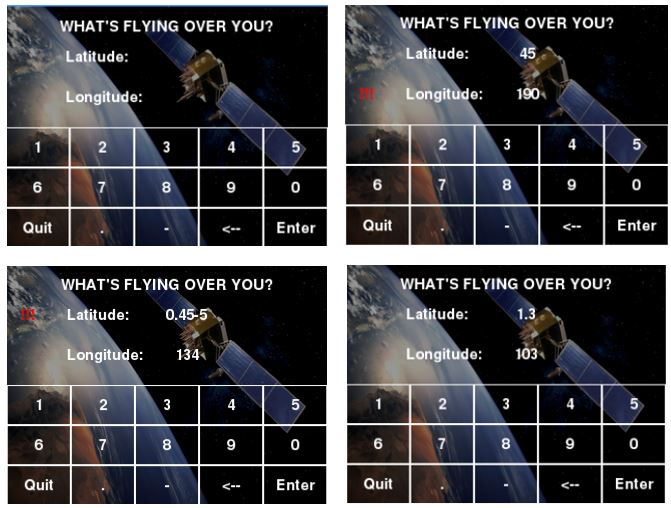
Figure 6 a - Default Level 1 screen where user can input desired coordinates. b - Errors when the coordinates are out of bounds. c - Errors when an invalid number format is entered. d - Example of a valid pair of GPS coordinates.
Level 2 Menu (Stage 3)
Level 2 of the menu displays the number of satellites overhead based on the local satellite information written to a text file in Stage 2. The code responsible for this section filters the satellites into five categories based on their type/function data. The five categories are Weather, Communication, Navigation, Scientific, and Miscellaneous. The categories and the number of satellites are displayed in Figure 7. The user has the option to press a category name and continue to Level 3 or press 'New Coordinates' and navigate to the first level of menu in which he/she can set new coordinates. The Level 2 of menu is updated in real time.
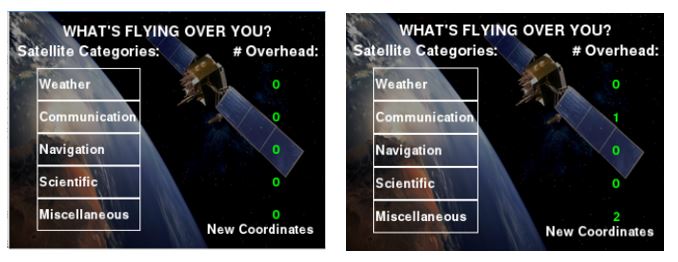
Figure 7 - Level 2 menu showing the number of satellites of each category flying overhead.
Level 3 Menu (Stage 3)
Level 3 uses the satellite information menu in the second level to display the names of the satellites flying overhead in the category pressed by the user in the previous level. If the user pressed a category that has no satellites, then the Level 3 menu would display a blank screen (Figure 8). The name of each satellite is displayed in a unique color in the Red-Green-Blue (RGB) color space. This RGB color also corresponds to the color of the LED that represents the same satellite in the Matrix (Stage 4). This was a design decision to enable users to identify and locate satellites easily when several are present. In Level 3, the user has the option to move back to Level 2 by pressing 'Back' or navigating to Level 4 by pressing the name of the satellite.
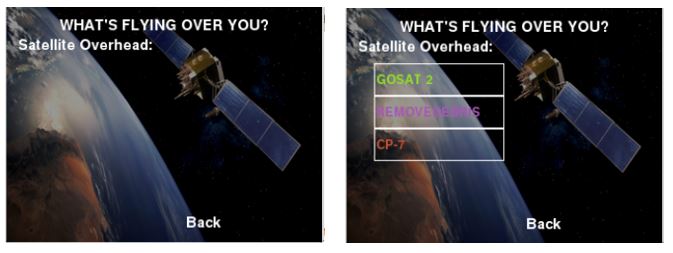
Figure 8 a - Level 3 menu when there are no satellites of the chosen category. b - Level 3 menu when there are 3 satellites in the chosen category.
A design choice was made to only display at most 5 satellite names in a category even if that category has more satellites. This design choice was made in order to remove the complexity of adding a scrolling display in the level as we observed that it was rare to get more than 5 satellites in one category at any given time. Another design choice was made to not update the Level 3 menu with new satellites in real time. For example, if there are 2 satellites in ‘Weather’ category and the user presses the category to see the names of the 2 satellites, those names will not change for the duration of the program until the user refreshes by returning to Level 2. The reason for this design choice was to allow the user to browse the satellite information in Levels 3-4 without them disappearing when they leave the region of interest.
Level 4 Menu (Stage 3)
The last Level displays detailed information about the satellite whose name was pressed by the user in Level 3 (Figure 9). On this level, the user can only read the information and navigate back to Level 3 when finished. The same two design choices were made at this level as in Level 3.
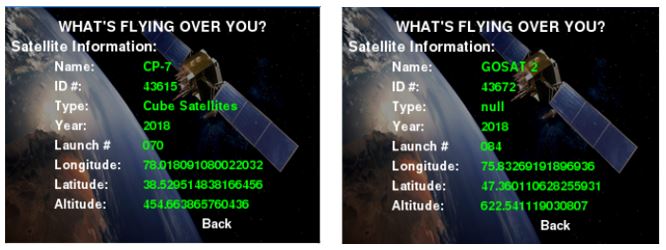
Figure 9 - Level 4 menu showing detailed information about two different satellites. The information includes all the static and dynamic information parsed in Stage 2.
LED Matrix Display
Overview
The LED Matrix was used to show how the satellites are moving over the FOV in real-time. The Raspberry Pi communicated the LED coordinates and RGB values to the Arduino over a Serial channel.
Hardware
Controlling the Matrix with the Pi interfered with the PiTFT. Therefore, we decided to control the Matrix with an Arduino. The Arduino Uno was our first choice to control the LED Matrix but we quickly realized that the Adafruit LED library interfered with Serial communication because it was using all of the Ports and overwriting the registers. Therefore, we changed to Arduino Mega that has multiple Serial channels and several more unused Ports. A bidirectional logic level converter is implemented to connect the 3.3V RPi to the 5.0V Arduino Mega. The hardware setup between the RPi, Arduino Mega, and the LED Matrix is shown in Figure 10.
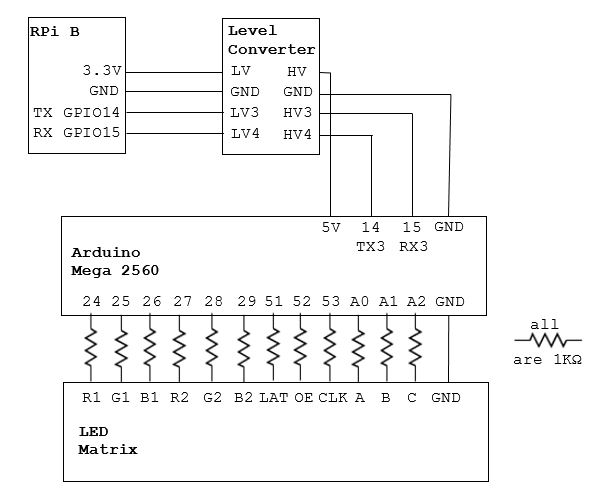
Figure 10 - Schematic diagram showing the hardware connections between the Raspberry Pi, the Arguino Mega, and the LED Matrix.
The Python code responsible for this stage obtains the coordinates/’Quit’ command from Stage 1 and reads the local satellite information from a text file from Stage 2. The bounds of the local FOV is mapped to the 16x16 LEDs of the LED matrix. The program then communicates the mapped coordinates and the RGB values to the Arduino byte-wise. The ranges of 5 variables being transmitted to the Arduino are as follows: X and Y coordinates are in the range [0, 15] each. R, G, and B values are in the range [30, 255]. Values below 30 are too dim on the LED matrix, and hence would not be ideal for display.
To ensure that the Arduino was parsing the information correctly, we implemented checksums that signaled the start and end of each transmission and each entry respectively (Figure 11). As numbers in the 20+ range were unused for any of the data types, we decided to use these as the start and end signals. I.e. to mark the start of a new transmission, the Raspberry Pi will send a ‘20’ to the Arduino, and to end the transmission, then it will send a ‘24’. Similarly, to mark the start and end of each satellite, the ‘21’ and ‘23’ will be used. ‘22’ is a hard terminate safety signal that is used to blank-out the Matrix in times of bugs or crashes.
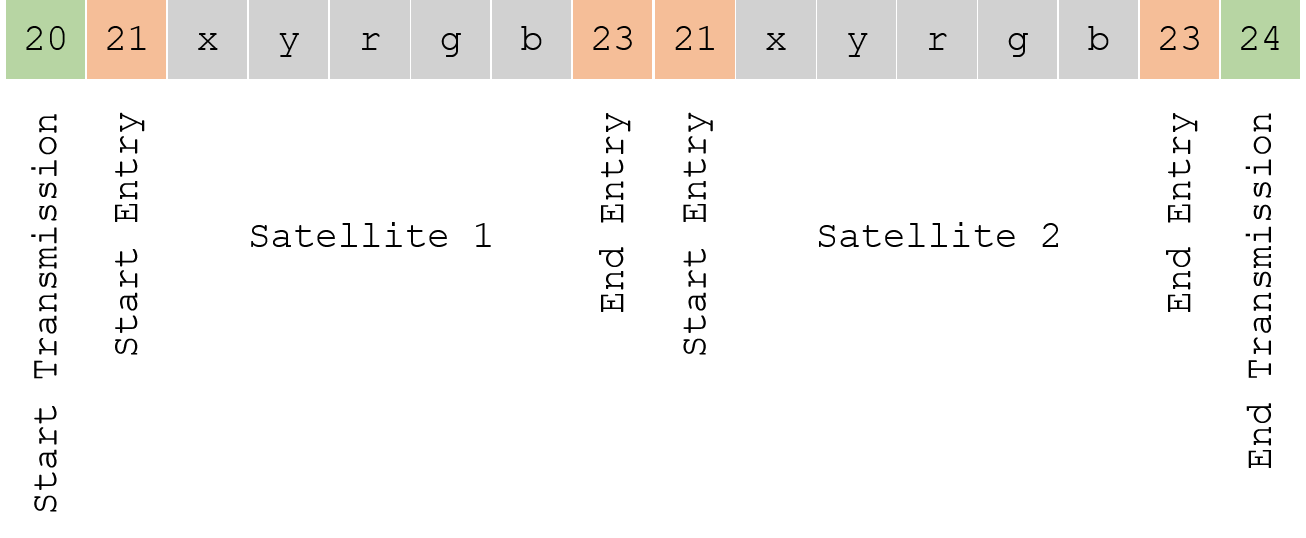
Figure 11 A representation of the transmission between the Pi and the Arduino when two satellites are present.
Upon receiving each new byte, the Arduino will check if the start and end signals have been triggered in the correct order. If it verifies that the correct information has been received, it will proceed to display the coordinates on the Matrix. Otherwise, it would simply discard the corrupted data and continue monitoring the communication channel for any new transmissions.
Results
The project was successfully implemented. For the demo, we decided to disconnect the Raspberry Pi’s external peripherals monitor, keyboard, and mouse but leave the ethernet cable to ensure that the TLE file download is fast. Because of our CPU use, we noticed that the RPi had a tendency to heat up, which caused the data processing in Stage 2 to slow down. Although not implemented, one way to fix this is to at a heat sink to the Pi processor. We also noticed that while the Level 2 menu and the LED matrix displayed the satellites correctly in real time, the Level 3 menu sometimes swapped the colors of the satellites when the satellite number increased. We have verified that it is a software bug, but it is not yet fixed.
Here is a video of our project:
Conclusion
We were able to successfully meet all of the goals that we set at the start of the project. The satellite information was displayed in a user-friendly and user interactive way on the PiTFT and the LED Matrix.
Future Work
An interesting extension to this project would be to connect the Raspberry Pi to a Ham Radio-like Yagi antenna that is capable of getting direct radio signals from satellites. With some signal processing algorithms, it would be possible to detect satellites in the immediate vicinity. A nice feature would be if the user could choose between the “indoor” mode where the user can choose to track satellites over the web, and the “outdoor” mode where the user can use the Yagi antenna to track satellites via radio signals.
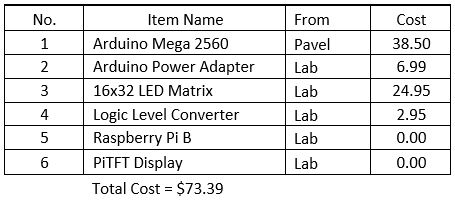
Bill of Materials
References
- James, B. (2018, October 22) Real Time Satellite Tracker Shows Toy What's Going Over Your Head Retrieved from Hackaday: https://hackaday.com
- Raspaudm M., Nielsen E. (2018) PyOrbital Documentation Retrieved from Python Documentation: https://pyorbital.readthedocs.io/en/latest/#
- Skovira J. (2018) ECE 5725 Embedded Operating Systems Lectures 1 to 4 College of Engineering, Cornell University, Ithaca, New York.
- Skovira J. (2018) ECE 5725 Embedded Operating Systems Lectures 10 to 13 College of Engineering, Cornell University, Ithaca, New York.
- Burgess P. (2018, June 27) LRGB LED Matrix Retrieved from Adafruit Tutorials: https://learn.adafruit.com/
- Kelso T. (2018, December 6) CelesTrak Retrieved from CelesTrak: https://celestrak.com/
- Yoder J. (2014, October 1) Stuff in Space Retrieved from Stuff in Space: http://stuffin.space/
- Arduino Inc. (2018, June 6) Arduino Serial Communication Retrieved from Arduino Tutorials: https://www.arduino.cc
- Liechti C. (2015) Python Serial Communication Retrieved from Python Documentation: https://pythonhosted.org/pyserial/
- Hutchinson R. (2014, November 10) Elon Musk Plans to Launch Internet Satellites Retrieved from Geeky Gadgets: https://www.geeky-gadgets.com
Work Distribution
The work was distributed as follows: Haritha implemented all the programs for Stage 2, as well as the Arduino code for Stage 4; Pavel implemented the programs for Stages 1 and 3, as well as the Pi code for Stage 4.
Acknowledgments
We would like to thank Prof. Skovira for a wonderful class, and for providing us with the opportunity to undertake such a fun project. We would also like to thank all our wonderful Teaching Assistants for their support the semester.
Code
The complete GitHub code repository can be found here.
Contact
We are Haritha Muralidharan (hm535) and Pavel Berezovsky (pvb23) from the ECE MEng 2018 batch. Get in touch with us for more details!